

If you compare third-party TikTok analytics with the native dashboard, you may notice that the numbers do not always match—and that can make it difficult to know which data deserves your trust.
The answer is not that one is always better than the other. TikTok’s native analytics should generally be your source of truth for TikTok-specific performance, while third-party analytics can be more useful for cross-platform reporting, comparisons, and broader social media workflows.
Let’s start by answering the most important question: which dashboard should actually guide your TikTok decisions?
Third-Party TikTok Analytics vs Native Dashboard: The Short Answer
If you are trying to decide between third-party TikTok analytics and the native dashboard, the simplest answer is this: use TikTok’s native analytics as the primary source for TikTok-specific performance data, and use third-party analytics as a complementary layer for reporting, comparison, and workflow management.
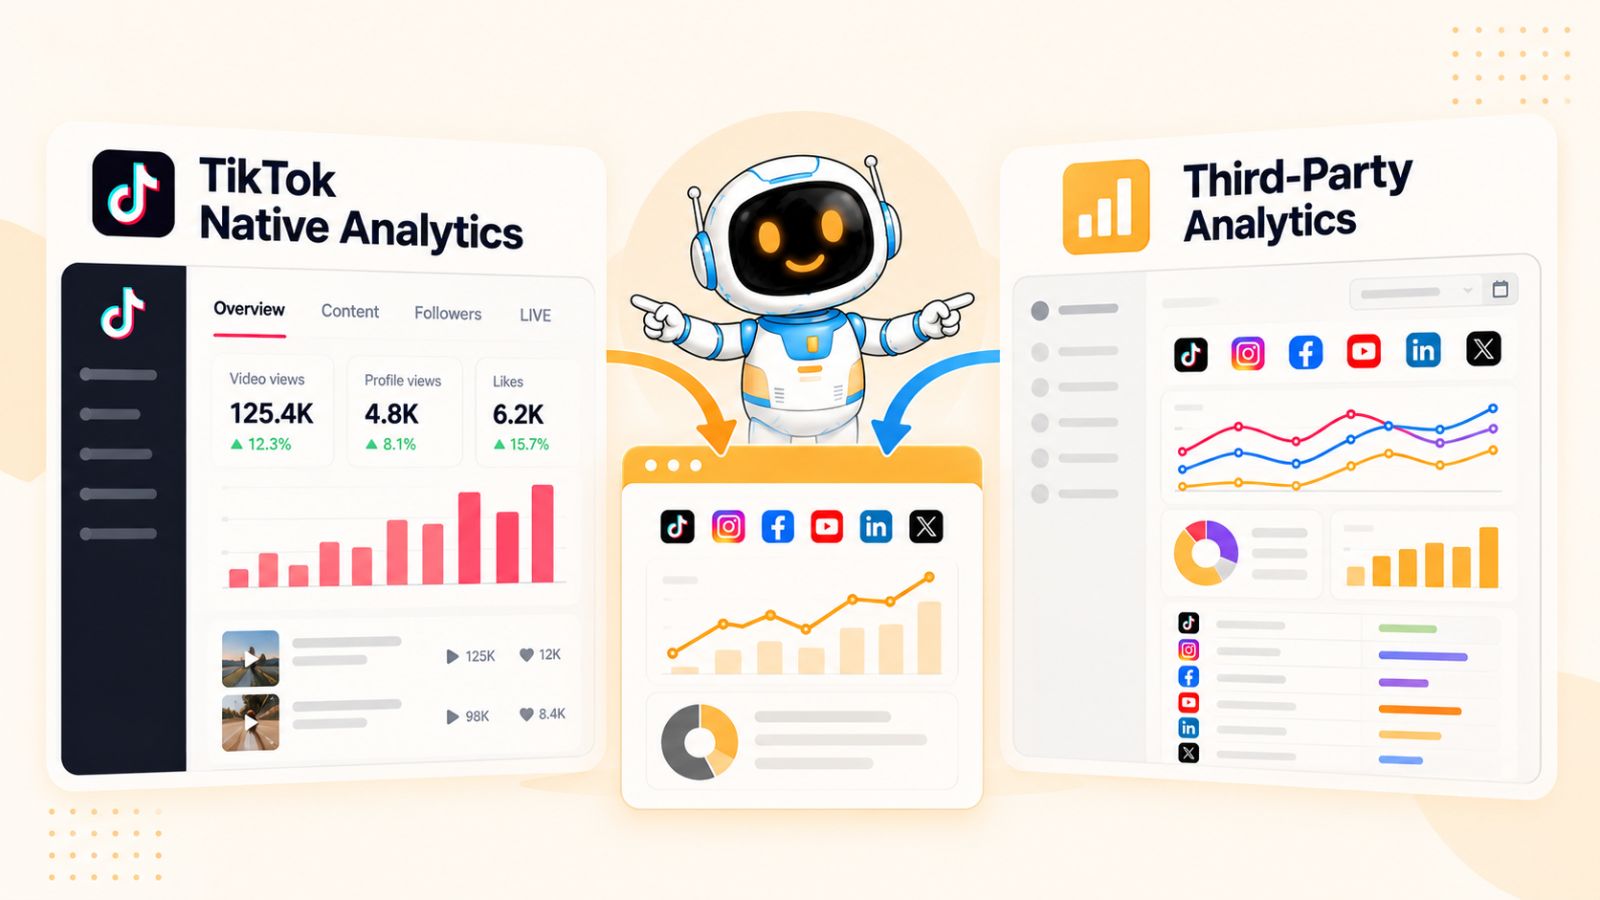
That distinction matters because these tools are not necessarily measuring or presenting data in exactly the same way. TikTok has direct access to activity happening on its platform, while third-party tools typically depend on the data TikTok makes available through its APIs and then organize, aggregate, or interpret that information within their own dashboards.
So if TikTok reports that a video received a certain number of views, that native figure should generally take priority when you are evaluating the video's official TikTok performance. A third-party dashboard showing a slightly different number does not automatically mean the third-party tool is inaccurate. The difference could come from data-refresh timing, reporting windows, metric definitions, API limitations, or how the platform processes the information.
The more useful question, therefore, is not “Which dashboard is right?” but “Which source is appropriate for this decision?”
For example, if you want to understand how one TikTok video performed, TikTok's own analytics are usually the best place to start. If you want to compare your TikTok performance with Instagram, Facebook, LinkedIn, or YouTube inside one reporting system, a third-party analytics platform may be considerably more convenient.
The same principle applies to social media management. A platform that helps you create, schedule, publish, and manage content across multiple networks solves a different problem from an analytics dashboard. For example, a tool such as Bibby can streamline the operational side of social media by helping with content creation, AI-assisted captions, scheduling, and publishing across platforms, but that does not make it a replacement for TikTok's native performance data.
The practical rule
Think of the two sources as serving different roles:
TikTok native analytics = authority for TikTok-specific measurement.
Third-party analytics = efficiency for aggregation, comparison, reporting, and workflow.
Once you understand that distinction, discrepancies between dashboards become much easier to interpret. Instead of choosing one platform and ignoring the other, you can establish a clear measurement hierarchy and use each source for what it does best.
That starts with understanding exactly what TikTok's native analytics measure.
What TikTok Native Analytics Actually Measures
TikTok’s native analytics dashboard is the first place you should look when you want to understand how your content is performing directly on TikTok. Because the data comes from the platform where the activity occurs, it provides the most direct view of how TikTok users are interacting with your videos, profile, and account.
Understanding what the native dashboard actually measures is important before comparing it with a third-party TikTok analytics platform. Many apparent discrepancies are not necessarily errors. They can happen because different platforms define, calculate, update, or display the same metric differently.
Video and Content Performance
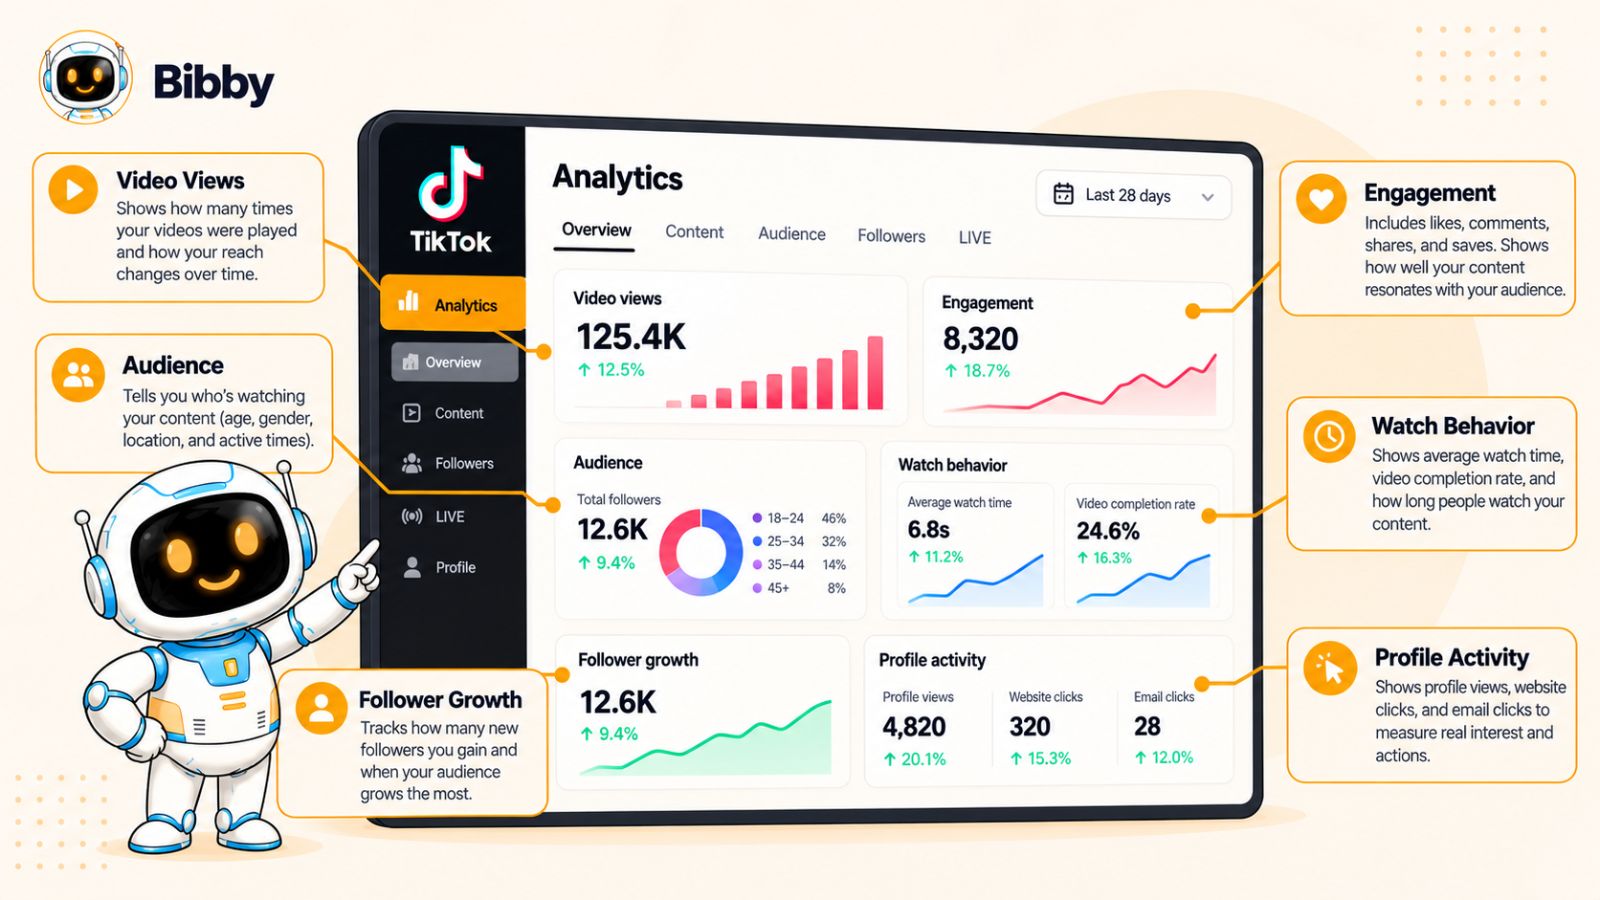
At the individual content level, TikTok analytics can help you understand how your videos perform after publication. Depending on the account, content type, and available TikTok features, you may encounter metrics such as views, likes, comments, shares, average watch time, total play time, and other indicators of video engagement.
These metrics help answer questions such as:
- Which videos are attracting the most attention?
- Which posts generate the strongest engagement?
- Are viewers watching the content or leaving quickly?
- Which videos encourage people to interact or share?
- How does one piece of content compare with another?
For content optimization, these native measurements are particularly valuable because they give you performance information directly from TikTok rather than forcing you to rely on a normalized version of the data from another platform.
Audience and Follower Insights
TikTok analytics can also provide information about your audience and follower activity. Depending on the analytics features available to your account, this may include information about audience characteristics, follower growth, and when your audience is active.
This information can influence both content strategy and publishing decisions. For example, if your audience consistently becomes more active during particular periods, that information can help you test different publishing times.
However, audience insights should be interpreted as strategic signals rather than guarantees. A time when your followers are active does not automatically mean a post published at that time will perform better. Content quality, topic relevance, competition, and TikTok's recommendation system can all influence distribution.
Engagement Metrics
Engagement metrics are another important part of TikTok analytics. Likes, comments, shares, and other interactions can help you understand whether viewers are doing more than simply watching your content.
However, engagement numbers should not be evaluated in isolation.
A video with fewer views but a strong rate of meaningful engagement could be more valuable to a particular brand than a video with millions of views and very little interaction. Likewise, a high number of views does not necessarily indicate that viewers watched the entire video or took the action you wanted.
This is one reason it is important to look at several related metrics rather than searching for one universal “best” number.
Profile and Account Activity
Native analytics can also help connect individual content performance with broader account activity. Depending on the available reporting features, you may be able to examine profile views, follower changes, and other account-level signals.
This broader context matters because the goal of TikTok marketing is rarely just to maximize video views. A business might instead want to increase awareness, attract potential customers, build an audience, drive profile visits, or generate interest in a product.
Looking only at video views can therefore give you an incomplete picture of whether your TikTok strategy is working.
Why Native Data Has an Important Advantage
The biggest advantage of TikTok's native analytics is not that every number is automatically more useful than the numbers in a third-party platform. It is that TikTok controls the underlying platform activity and determines how its own metrics are defined and reported.
That makes the native dashboard particularly important when you need to verify TikTok-specific performance.
For example, if a third-party dashboard reports a different number of video views than TikTok, you should not immediately assume that TikTok's number is wrong. Instead, check the reporting period, update time, metric definition, and data source before deciding that there is a genuine data-quality problem.
This distinction becomes even more important when you start comparing TikTok with other social networks. A third-party platform can make cross-platform reporting much easier, but standardizing data across networks can also introduce differences that do not exist inside each platform's own reporting environment.
Native Analytics Are Not the Whole Social Media Workflow
TikTok's analytics dashboard is designed primarily to help you understand what is happening on TikTok. It is not necessarily designed to manage your entire social media operation.
That is where broader social media management platforms can play a different role. A tool such as Bibby, for example, can help manage content creation, captions, scheduling, and publishing across multiple platforms, while TikTok's native dashboard remains the more appropriate place to validate TikTok-specific performance.
Keeping these functions separate helps avoid a common mistake: assuming that the tool you use to manage and schedule content must also be the definitive source for measuring that content's performance.
The next step is to look at what third-party TikTok analytics platforms actually do with the data they receive.
What Third-Party TikTok Analytics Tools Actually Do
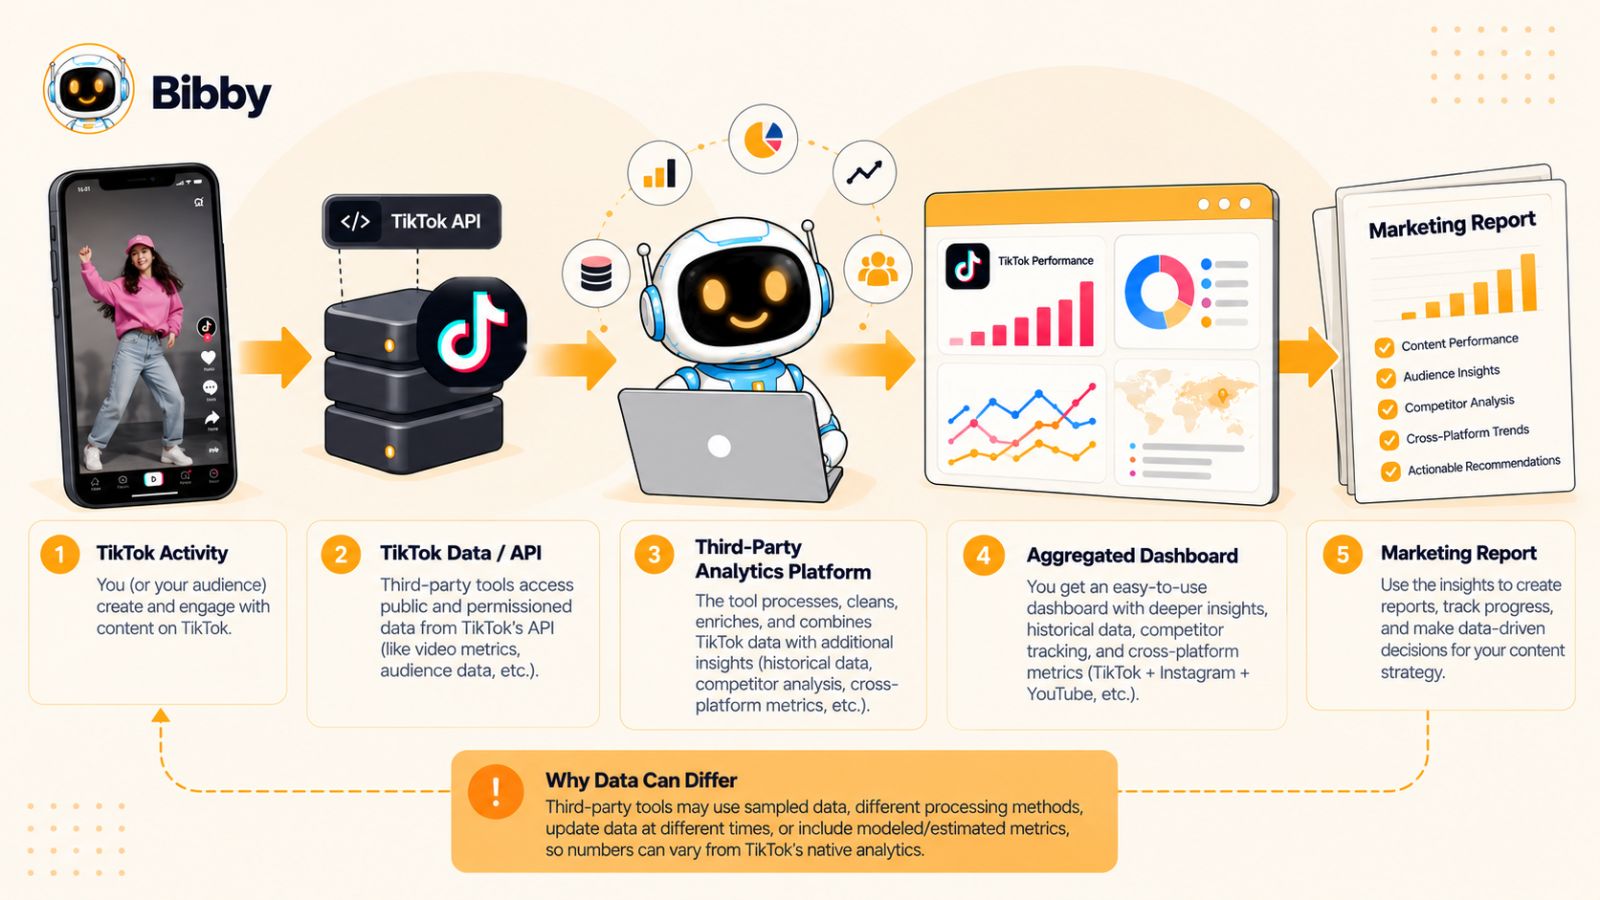
Third-party TikTok analytics tools are built to make social media data easier to organize, compare, report, and act on. Instead of relying only on TikTok’s own interface, these platforms connect with supported TikTok data sources and bring selected metrics into a separate dashboard.
That extra layer can be extremely useful for marketers managing multiple accounts or multiple social networks. But it also means you need to understand where the data comes from and what happens to it before you compare it with TikTok’s native dashboard.
Third-Party Analytics Usually Depend on Available Platform Data
A third-party platform does not have unrestricted access to everything happening inside TikTok. The data it can collect depends on the access TikTok makes available through its APIs and other supported integrations.
The third-party platform then uses that available information to create its own reporting experience.
This distinction is important because a third-party dashboard may not have access to exactly the same data, at exactly the same time, or in exactly the same format as TikTok's internal analytics system.
As a result, you should not expect every metric to match perfectly.
Third-Party Platforms Add a Reporting Layer
One of the biggest advantages of third-party analytics is that they can turn data from several social networks into a more consistent reporting workflow.
Imagine that a brand publishes content on TikTok, Instagram, Facebook, LinkedIn, and YouTube. Checking every platform separately can make reporting slow and difficult, particularly when a marketing team needs to compare performance across a common period.
A third-party dashboard can bring supported data into one environment, allowing marketers to identify patterns more efficiently.
For example, instead of asking:
How did our TikTok account perform?
a marketing team can ask:
Which social network generated the strongest engagement this month, and which content themes performed best across platforms?
That is a different analytical problem, and third-party tools can be particularly useful for it.
Aggregation Can Make Cross-Platform Comparisons Easier
Social networks do not all define their metrics in exactly the same way.
A view on TikTok is not necessarily equivalent to a view on another platform. Reach, impressions, engagement rate, video completion, and other metrics can also have platform-specific definitions.
A third-party platform may therefore standardize how information is displayed so marketers can compare channels more easily.
This is convenient, but it creates an important caveat: standardized reporting does not mean identical measurement.
If a dashboard places TikTok and Instagram metrics next to each other, you still need to understand what each underlying platform means by those metrics.
A clean-looking dashboard can make fundamentally different measurements appear more comparable than they actually are.
Some Third-Party Metrics May Be Calculated
Not every number displayed by an analytics platform necessarily comes directly from TikTok as a native metric.
A platform may calculate derived metrics such as engagement rate, growth rate, averages, percentages, rankings, or other performance indicators based on the underlying data.
For example, two tools could calculate engagement rate differently depending on whether they divide engagement by views, reach, followers, or another denominator.
Neither dashboard necessarily has to be “broken.” They may simply be using different formulas.
That is why marketers should always check the definition of a metric before comparing it across tools.
Reporting Speed Can Also Create Differences
Another common reason for discrepancies is timing.
TikTok may update a metric at one point, while a third-party platform retrieves or refreshes that information later. Depending on the platform and reporting setup, there can be a delay between activity occurring on TikTok and that activity appearing in an external dashboard.
This becomes particularly noticeable when you compare very recent posts.
A video published today may show one number inside TikTok while a third-party dashboard still reflects an earlier data snapshot.
For that reason, comparing dashboards immediately after publication is usually less reliable than comparing them after both systems have had enough time to process and update the data.
Third-Party Analytics Are Most Valuable When They Add Context
The strongest reason to use third-party TikTok analytics is not necessarily to replace TikTok's native dashboard.
It is to add context.
A third-party platform can help you answer broader questions about your social media strategy:
- Which platforms are growing fastest?
- Which content themes work across networks?
- How does TikTok performance compare with other channels?
- Which campaigns are generating the strongest overall engagement?
- How can a team simplify recurring reporting?
- How can content performance be connected to a broader publishing workflow?
This is especially useful for teams that already manage content across several platforms.
For example, a social media workflow may involve creating content, generating captions, scheduling posts, publishing them across networks, and then analyzing the resulting performance. Tools such as Bibby can help simplify parts of that operational workflow, while dedicated analytics systems can help interpret performance afterward.
The key is to understand that workflow efficiency and measurement authority are separate concepts.
A third-party tool can be extremely useful without becoming the final authority for every TikTok metric.
Third-Party Does Not Mean Unreliable
There is a common misconception that native analytics are accurate while third-party analytics are automatically inaccurate.
That is too simplistic.
A reputable third-party platform can provide valuable and reliable information, particularly when it clearly explains its data sources, metric definitions, update frequency, and limitations.
The real issue is whether the data is appropriate for the decision you are making.
If you need the most authoritative TikTok-specific number, start with TikTok.
If you need consolidated reporting, cross-platform comparisons, team workflows, or a more convenient analytical interface, a third-party platform can be extremely valuable.
The challenge comes when two dashboards show different numbers. To decide which one to use, you first need to understand exactly why those numbers can diverge.
Why TikTok Analytics Numbers Differ Between Tools
Seeing different numbers in TikTok's native dashboard and a third-party analytics platform does not necessarily mean that one of them is wrong. In many cases, the discrepancy comes from how the two systems collect, process, update, or define the data.
This is one of the most important things to understand when comparing third-party TikTok analytics vs native dashboard data. If you expect every number to match exactly, you may end up treating normal reporting differences as data-quality problems.
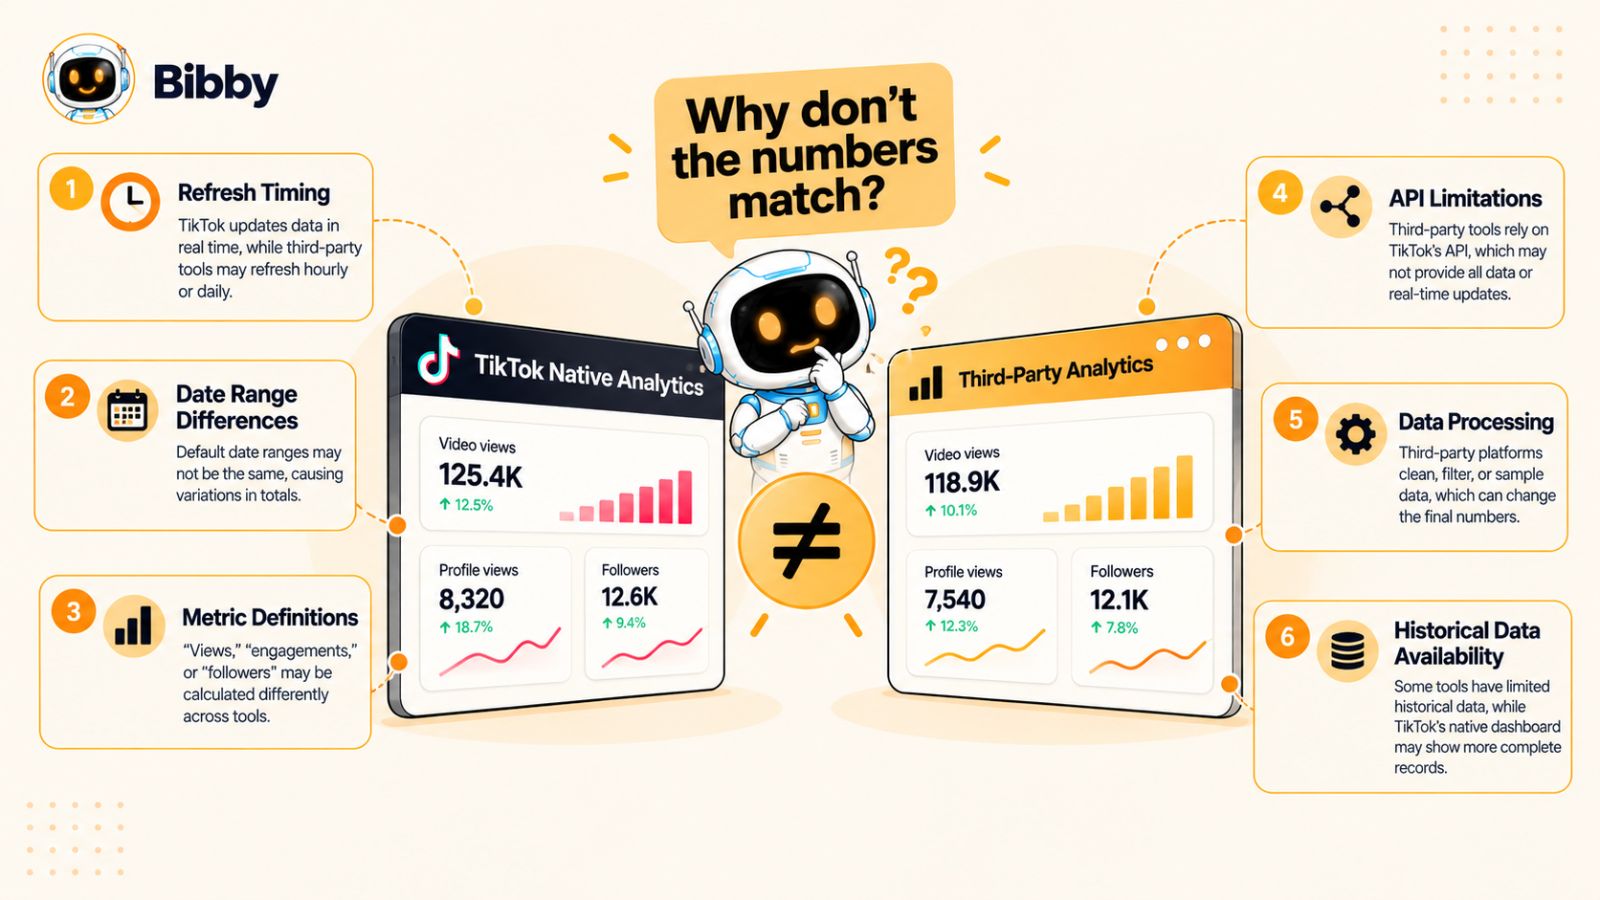
API Limitations and Data Availability
Third-party analytics platforms generally depend on the data TikTok makes available through its supported integrations and APIs.
TikTok's internal analytics environment can have access to platform-level information that is not necessarily exposed to external applications in the same way.
That creates an important distinction:
TikTok can potentially report information from its own internal systems, while a third-party platform can only work with the information it is permitted and technically able to access.
If a particular metric is unavailable through an external integration, a third-party platform may omit it, calculate a related metric differently, or present a more limited version of the information.
This does not necessarily indicate poor analytics. It can simply reflect the boundaries of the data source.
Different Data Refresh Times
Analytics are not always updated simultaneously across platforms.
TikTok may update its own dashboard before a third-party platform retrieves the latest available information. The external platform might refresh on a schedule rather than continuously.
For example, suppose a TikTok video has accumulated 100,000 views. TikTok's dashboard may already reflect that activity while a third-party dashboard is still displaying an earlier snapshot.
If you compare the two at that exact moment, you could conclude that the tools disagree.
Wait for the third-party system to refresh, however, and the difference may become much smaller.
This is why very recent performance data should be treated carefully.
Different Reporting Windows
One of the easiest ways to create a false discrepancy is to compare different date ranges.
For example, TikTok might be showing performance from September 1 through September 30, while a third-party report is configured for September 1 through October 1.
Even a one-day difference can materially change metrics for an active account.
Before comparing numbers, check:
- Start date
- End date
- Time zone
- Account or profile selected
- Content included
- Whether the report uses publication date or performance date
A surprising number of analytics disagreements disappear once these settings are aligned.
Time Zone Differences
Time zones can create particularly confusing discrepancies around midnight.
Imagine a post is published late at night in one time zone. TikTok and a third-party platform may use different reporting conventions for determining which day the resulting activity belongs to.
The total performance may eventually align, but daily reporting can temporarily look different.
This matters when you are comparing day-by-day performance, calculating daily growth, or preparing monthly reports.
For serious reporting, choose a standard time zone and use it consistently.
Metric Definitions Can Differ
The word “engagement” sounds straightforward, but it can mean different things depending on the analytics platform.
One platform might calculate engagement rate using views. Another might use reach. Another could use followers.
The same issue can occur with terms such as:
- Views
- Reach
- Impressions
- Engagement
- Engagement rate
- Watch time
- Completion rate
- Follower growth
Before deciding that one tool has inaccurate data, find out how both platforms define the metric.
This is particularly important when comparing TikTok with other social networks. A metric can have the same name across platforms while representing different underlying behavior.
Aggregation and Rounding
Third-party platforms often aggregate data to make reporting easier.
A dashboard may summarize daily information into weekly or monthly totals, calculate averages, or round percentages.
That can produce small differences even when the underlying data is broadly consistent.
For example, if a platform rounds several daily percentages before calculating a monthly average, its final figure may differ slightly from a calculation performed using the raw underlying values.
Small differences are therefore not automatically a reason to distrust a platform.
The size and consistency of the discrepancy matter.
Historical Data Can Be Different
Historical reporting can also vary between native and third-party systems.
A third-party platform may only begin collecting information after an account is connected. It may not have access to the same historical depth available inside TikTok.
Some platforms may also store snapshots of data rather than continuously reconstructing historical figures.
This means that two dashboards could have different historical records even if they agree on more recent activity.
When evaluating a third-party analytics tool, therefore, ask how far back its data goes and whether historical metrics were imported or collected after the account was connected.
Deleted, Private, or Unavailable Content
Content changes can also affect reporting.
A video that is deleted, made private, restricted, or otherwise becomes unavailable may be treated differently by TikTok and an external analytics platform.
One system may retain historical information about the content, while another may no longer include it in certain reports.
This is another reason why historical totals can sometimes change or fail to reconcile perfectly.
Attribution and Calculation Methods
Some metrics are not simply numbers that TikTok sends to a dashboard. They may involve calculations based on multiple data points.
This is especially relevant for metrics such as conversion rates, engagement rates, growth percentages, or campaign-level performance.
If two systems use different attribution rules or formulas, their results can differ even when they are working from valid data.
The important question is not simply:
“Why doesn't this number match?”
It is:
“What exactly is this number measuring, and how was it calculated?”
That question produces much better analytics decisions.
Which Differences Should Concern You?
Not every discrepancy deserves investigation.
A small difference caused by refresh timing, rounding, or slightly different reporting windows may be completely normal.
You should investigate more carefully when:
- The difference is consistently large.
- The discrepancy remains after matching date ranges.
- The platforms appear to use different metric definitions.
- A large amount of content is missing.
- Historical data suddenly changes without explanation.
- A third-party platform cannot explain where a metric comes from.
- The tool presents an estimate as if it were an official TikTok metric.
Transparency matters.
A trustworthy analytics platform should make it reasonably clear where its data comes from, how often it is updated, and how calculated metrics are defined.
Once you understand these causes, the question becomes much easier to answer: when TikTok and a third-party dashboard disagree, which number should actually control your reporting and decisions?
Which TikTok Analytics Should You Trust?
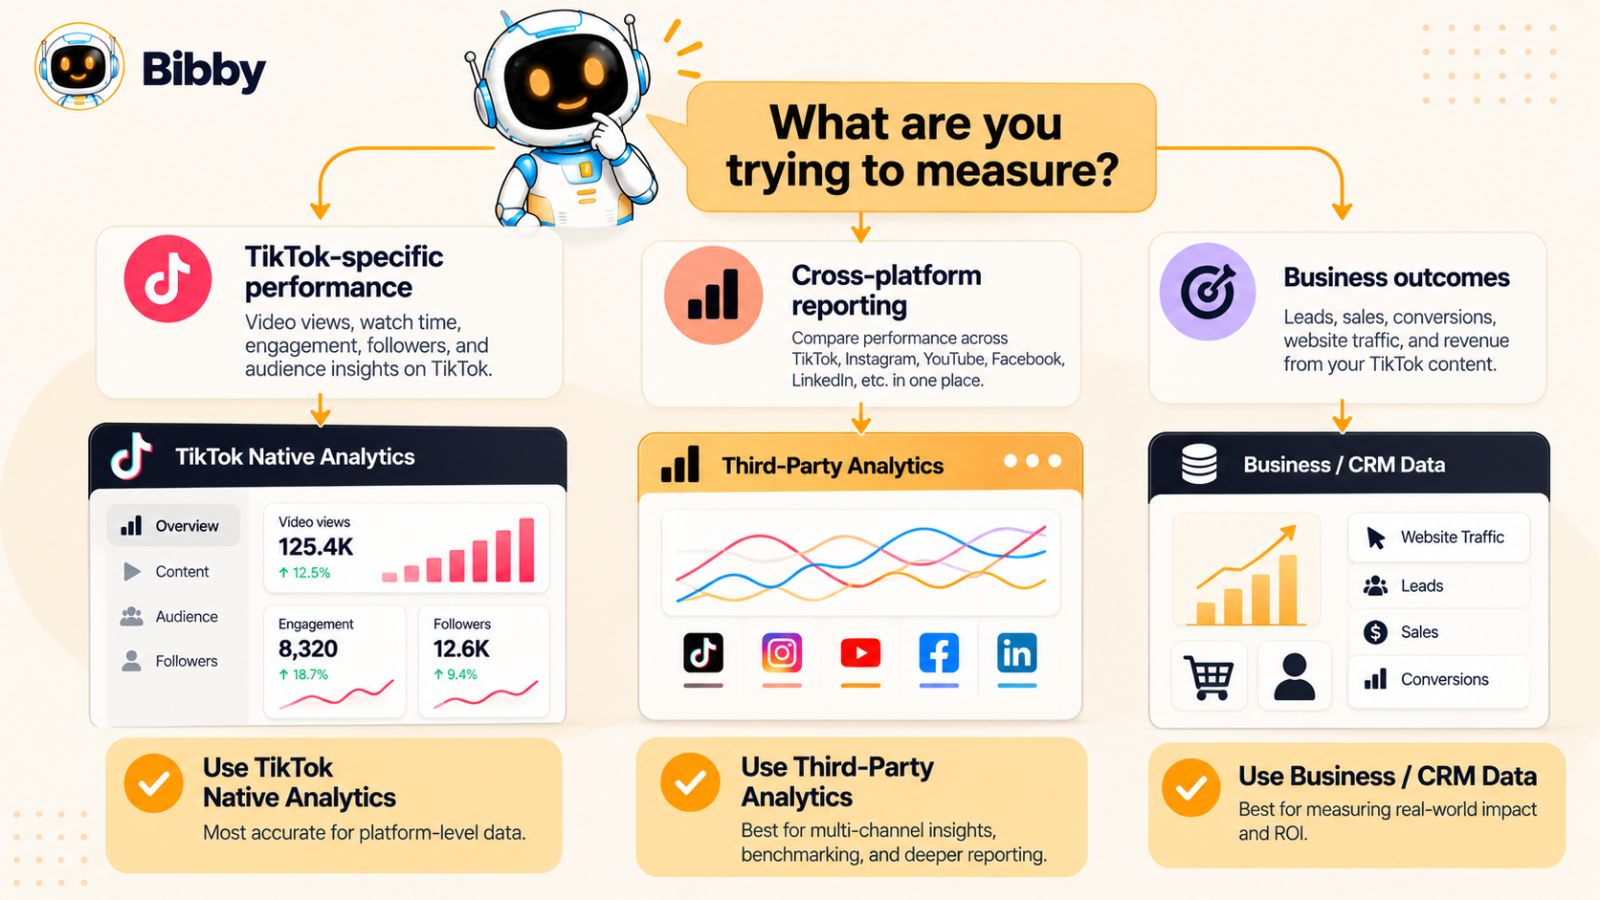
The best way to decide between third-party TikTok analytics and the native dashboard is to stop treating the choice as an either-or decision.
TikTok's native analytics should generally be your primary reference for TikTok-specific performance data. Third-party analytics are most useful when you need to organize information, compare multiple social networks, build recurring reports, or connect analytics with a broader social media workflow.
In other words, the most trustworthy analytics source depends on what you are trying to find out.
When TikTok Native Analytics Should Take Priority
If the question is specifically about what happened to your content on TikTok, start with TikTok.
For example, if you want to verify the official performance of a particular video, TikTok's own analytics should generally be the reference point. The same applies when you are investigating audience information, content-level performance, or other TikTok-specific metrics.
This gives you a simple rule:
When TikTok itself is the subject of the measurement, prioritize TikTok's own reporting whenever the relevant metric is available.
That does not mean every native metric is automatically more useful. It means the platform's own reporting is generally the most appropriate authority for understanding activity that occurred within that platform.
When Third-Party Analytics Make More Sense
Third-party analytics become particularly useful when your question extends beyond TikTok.
Suppose a brand publishes the same campaign across TikTok, Instagram, Facebook, LinkedIn, and YouTube. Looking at each native dashboard separately can make it difficult to build a consistent overview.
A third-party analytics platform can bring supported information into one reporting environment.
That can make it easier to answer questions such as:
- Which platform generated the most engagement?
- Which campaign performed best overall?
- Which content themes are working across multiple channels?
- How has social performance changed over several months?
- Which accounts need attention?
- How can recurring client or management reports be simplified?
For these use cases, convenience and aggregation can be more valuable than having every metric originate from the native platform.
A Practical Source-of-Truth Framework
A useful way to structure your reporting is to assign each source a specific role.
| Analytics question | Best starting point |
|---|---|
| How many views did a TikTok video receive? | TikTok native analytics |
| How did a specific TikTok video perform? | TikTok native analytics |
| What is happening with my TikTok audience? | TikTok native analytics |
| How is TikTok performing against Instagram? | Third-party analytics |
| How did all social channels perform this month? | Third-party analytics |
| How should an agency consolidate client reporting? | Third-party analytics |
| What is the official TikTok-specific performance figure? | TikTok native analytics |
| How should a social media team organize publishing and reporting? | Combination of tools |
This framework prevents a common mistake: forcing one tool to do every job.
Use Native Data for Verification
Even when your team relies heavily on a third-party analytics platform, it is useful to periodically validate important figures against TikTok's native dashboard.
This is especially important when:
- A number looks unusually high or low.
- A campaign report contains a significant discrepancy.
- A post has unexpectedly strong performance.
- Historical numbers change.
- A new metric has been introduced.
- You are preparing an important client or executive report.
Think of TikTok's dashboard as the verification layer for TikTok-specific questions.
The third-party dashboard can remain your day-to-day reporting environment without becoming the unquestioned authority for every number.
Do Not Automatically Choose the Dashboard With the Bigger Number
A common reporting mistake is assuming that the larger number must be more accurate.
It isn't.
If one dashboard reports 500,000 views and another reports 520,000, the difference alone does not tell you which figure is correct.
You need to understand:
- What period was measured?
- When was each dashboard updated?
- Are both tools using the same metric definition?
- Is one figure calculated rather than directly reported?
- Are both systems including the same content?
- Is one platform using estimated or normalized data?
Analytics is not a competition to find the biggest number.
It is a process of determining which measurement is appropriate for the question you are asking.
Build Your Reporting Rules Before You Need Them
Businesses can avoid many analytics disputes by establishing reporting rules in advance.
For example, a social media team might decide:
TikTok native analytics are the authority for TikTok-specific performance metrics, while the company's third-party dashboard is used for consolidated monthly reporting and cross-platform analysis.
That simple rule creates consistency.
It also means that if a stakeholder asks why the TikTok number in a monthly report differs slightly from the number currently visible inside TikTok, the team has a documented methodology rather than having to explain the discrepancy from scratch.
Trust the Source, But Also Understand the Metric
Ultimately, good analytics is not about blindly trusting one dashboard.
It is about understanding the relationship between the data source, metric definition, reporting period, and business decision.
TikTok's native dashboard is usually the strongest reference for TikTok-specific measurements. Third-party analytics can add significant value by making those measurements easier to organize, compare, and report alongside other channels.
The smartest approach is therefore not to choose one dashboard and ignore the other.
Use TikTok as your measurement authority for TikTok-specific data, and use third-party analytics to turn that data into broader marketing insight.
That distinction becomes even clearer when you compare the most important TikTok metrics individually.
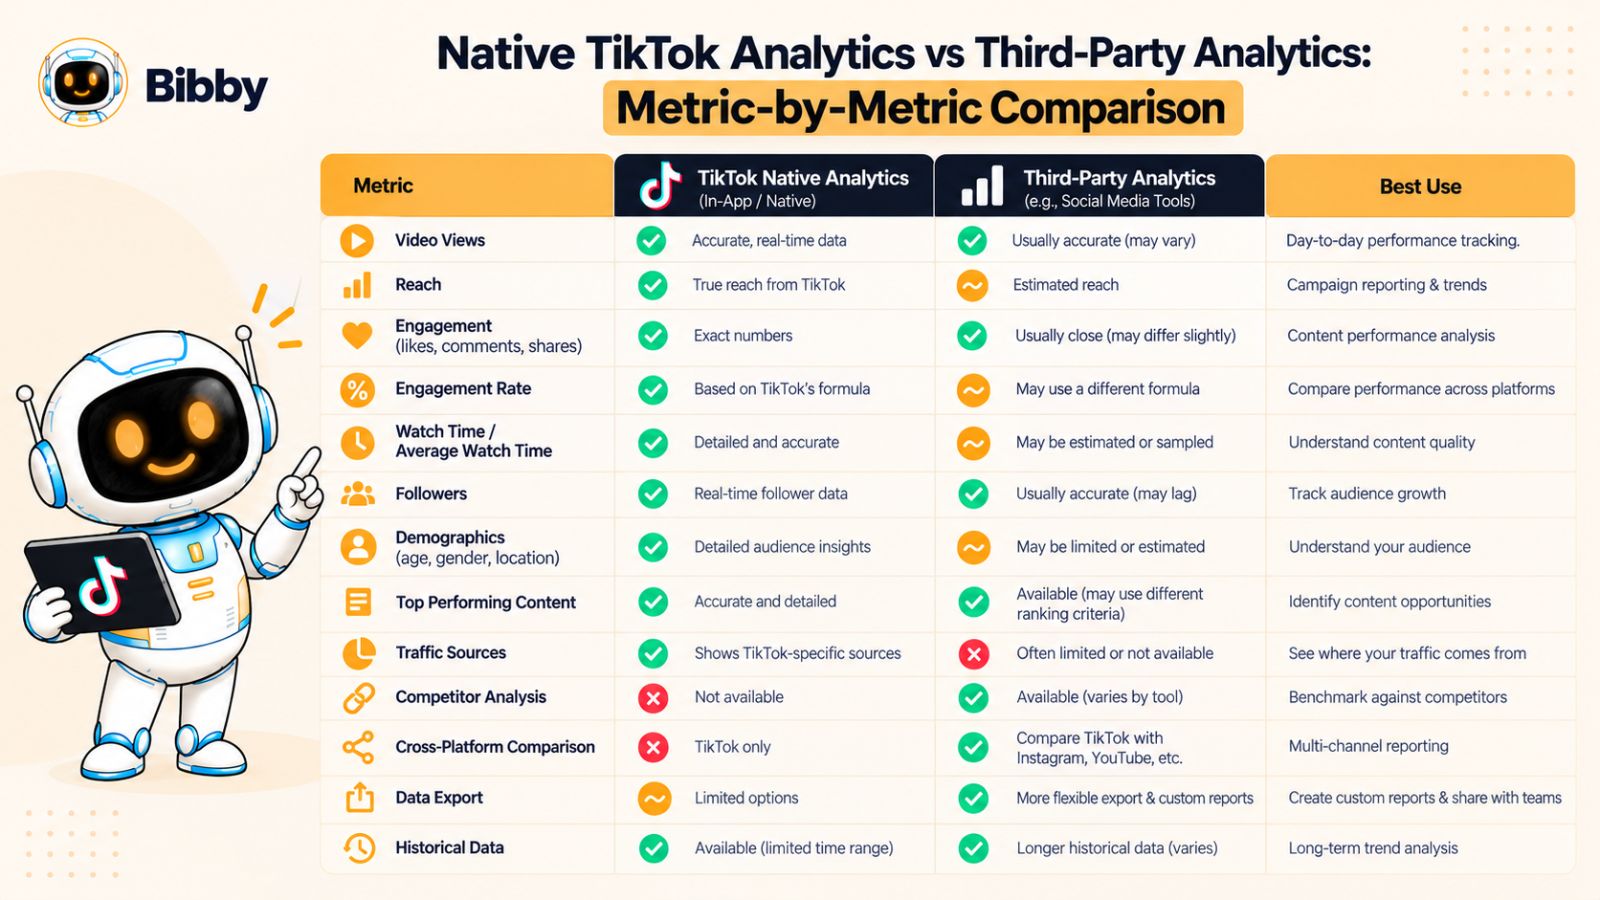
Native TikTok Analytics vs Third-Party Analytics: Metric-by-Metric Comparison
Not every TikTok metric deserves the same level of trust from every data source. Some metrics are best taken directly from TikTok, while others become more useful when a third-party platform calculates, organizes, or compares them across multiple networks.
The key is to understand what each metric represents before deciding which dashboard to use.
TikTok Views
For video views, TikTok's native analytics should generally be your primary reference.
Views are one of the most visible TikTok performance metrics, but they can also be one of the easiest to misunderstand when comparing platforms. A third-party tool may display a different number because of refresh timing, API availability, reporting windows, or how historical data is stored.
If you are publishing a report that says a particular TikTok video received a specific number of views, verify the figure against TikTok when accuracy matters.
TikTok Reach and Impressions
Reach and impressions should be treated carefully because marketers sometimes use these terms interchangeably even though they describe different concepts.
Reach generally concerns the number of unique users exposed to content, while impressions represent the number of times content was displayed. Exact availability and definitions can vary by platform and reporting environment.
If TikTok provides the specific metric you need, its native reporting is generally the best reference for TikTok-specific analysis.
When using a third-party platform, check its metric definition before comparing it directly with TikTok.
Likes, Comments, and Shares
Basic engagement actions such as likes, comments, and shares are generally straightforward to interpret.
However, differences can still appear if the third-party platform has not refreshed its data or is using a different reporting period.
For a specific TikTok video, native analytics are usually the best place to verify these figures.
For cross-platform reporting, however, a third-party dashboard can make it easier to compare engagement patterns across different networks.
TikTok Engagement Rate
Engagement rate is one of the metrics you should be especially careful with.
There is no single universal formula for engagement rate.
For example, a platform might calculate engagement rate using:
Total engagements ÷ views × 100
Another might use:
Total engagements ÷ reach × 100
Another could use followers as the denominator.
This means two dashboards can calculate different engagement rates from the same underlying activity without either one necessarily being technically wrong.
Before comparing engagement rates, always check the formula.
If you are using a third-party platform for reporting, consistency is often more important than choosing one particular formula. Use the same methodology over time so your trends remain meaningful.
Follower Growth
Follower counts and follower growth are useful for understanding whether your account is building an audience over time.
TikTok's native dashboard should generally be your primary reference when you need to verify TikTok follower data.
Third-party platforms can still be useful for tracking growth trends over longer periods, especially when you want to compare TikTok's audience growth with other social networks.
The important thing is to maintain consistent measurement dates and avoid comparing snapshots taken at different times.
Profile Views
Profile views can help connect content discovery with deeper account interest.
For example, a video might not generate the highest number of views but could drive an unusually high number of profile visits. That may be a stronger signal for a business trying to attract potential customers than raw video views alone.
When available, TikTok's native reporting is the best place to validate TikTok-specific profile activity.
A third-party dashboard can then help incorporate that information into a wider performance report.
Watch Time and Average Watch Time
Video watch time can provide much more context than views alone.
A video with a large number of views but weak viewing duration may tell a very different story from a video with fewer views and stronger retention.
When analyzing watch time, pay close attention to the exact metric being displayed. Total watch time, average watch time, and percentage watched answer different questions.
Native TikTok analytics are generally the best starting point for diagnosing the performance of individual TikTok videos because the data is tied directly to the platform's video experience.
Completion Rate and Retention
Completion and retention metrics can help you understand whether viewers continue watching your content.
These metrics can be particularly useful when improving:
- Video hooks
- Pacing
- Story structure
- Video length
- Calls to action
- Content formats
If a third-party tool provides retention-related metrics, verify how those figures are defined before comparing them with TikTok's native reporting.
A metric labeled “completion rate” is only useful for comparison if you know exactly what counts as a completed view.
Audience Demographics
Audience insights are another area where native TikTok analytics should generally take priority.
If you are making decisions about who watches your content, TikTok's own audience reporting is the most direct source for TikTok-specific audience information.
Third-party platforms can still help you consolidate audience information across several channels, but marketers should avoid assuming that demographic categories from different networks are perfectly equivalent.
A 25–34 audience segment on TikTok may not be directly comparable to the same-looking segment on another platform because the underlying datasets and methodologies can differ.
Traffic and Conversion Metrics
Traffic and conversion reporting requires more caution because it can involve several systems rather than TikTok alone.
For example, a marketer may be dealing with TikTok analytics, website analytics, tracking parameters, attribution software, and a CRM.
In these situations, there may not be one dashboard that provides the complete truth.
The best approach is to define which system is authoritative for each stage of the customer journey.
TikTok can help explain what happened on the platform. Website analytics can help explain what happened after someone reached the site. A CRM may ultimately provide the most useful information about qualified leads or customers.
The Bigger Lesson
The important point is that there is no single analytics dashboard that must win every comparison.
Native TikTok analytics are generally strongest for TikTok-specific platform measurements. Third-party analytics are often strongest when you need organization, aggregation, cross-platform comparison, or recurring reporting.
Once you assign each source the right role, discrepancies become much less disruptive.
You can use native TikTok data to understand what happened on TikTok and third-party reporting to understand what that performance means in the context of your broader social media strategy.
The next question is where third-party TikTok analytics provide enough additional value to justify using them in the first place.
When Third-Party TikTok Analytics Is More Useful
Third-party TikTok analytics become most valuable when your question extends beyond a single TikTok account or a single native dashboard. Their biggest advantage is usually not replacing TikTok's own data, but making social media data easier to compare, organize, report, and act on.
For an individual creator managing one account, TikTok's native analytics may be enough. For a brand, agency, or marketing team managing several channels, the value of a third-party platform can increase significantly.
Cross-Platform Performance Reporting
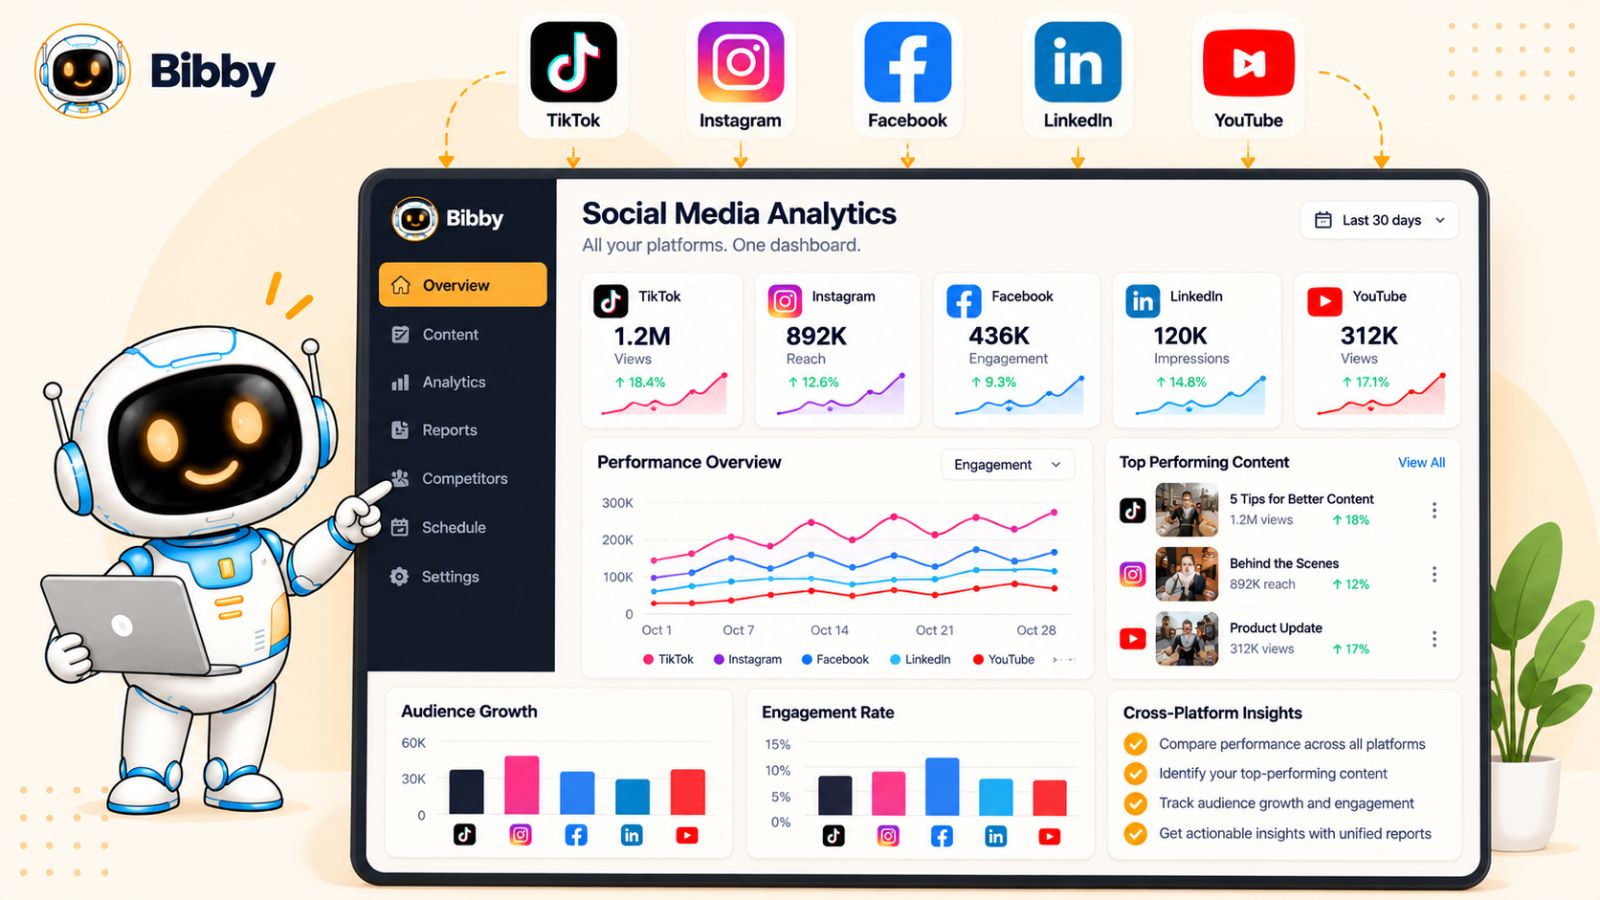
One of the strongest reasons to use third-party analytics is the ability to bring multiple social networks into one reporting environment.
A brand might publish on TikTok, Instagram, Facebook, LinkedIn, and YouTube. Each platform has its own native analytics interface, terminology, reporting periods, and workflows.
Checking each dashboard individually can make it difficult to answer broader questions such as:
- Which platform is generating the strongest engagement?
- Which channel is growing fastest?
- Which campaign performed best across social media?
- Which content formats are working across multiple platforms?
- How has overall social performance changed month over month?
A third-party analytics platform can make these comparisons considerably easier.
The important caveat is that cross-platform reporting should be treated as a comparison framework, not proof that every platform measures the same thing in exactly the same way.
Agency and Client Reporting
Third-party analytics can be particularly useful for agencies managing multiple social media accounts.
Instead of manually collecting screenshots and numbers from several native dashboards, an agency can use a centralized reporting system to organize recurring performance information.
This can reduce administrative work and create a more consistent reporting process.
However, agencies should still distinguish between platform-native metrics and third-party calculated metrics in client reports.
For example, if a report contains a TikTok view count, the agency should know whether that figure comes directly from TikTok, when it was retrieved, and whether the third-party platform has modified or aggregated it.
Transparency builds more trust than simply presenting a polished dashboard.
Comparing Content Across Platforms
Third-party analytics can also help identify patterns that are difficult to see when every social network is analyzed separately.
Suppose a brand publishes short educational videos on TikTok, Instagram Reels, and YouTube Shorts.
The team may want to know whether a particular topic consistently performs well regardless of platform.
A centralized analytics system can make that comparison easier.
It can reveal patterns such as:
- A topic that consistently generates engagement.
- A format that performs particularly well on TikTok.
- A campaign that works better on Instagram than TikTok.
- Content themes that generate views but fail to generate meaningful interaction.
- Posts that perform differently depending on the platform.
This type of analysis moves beyond the question of “How many views did this TikTok receive?” and toward the more useful question of “What should we create next?”
Historical Trend Analysis
Third-party platforms can also be useful for monitoring performance over longer periods.
A marketing team may want to compare quarterly growth, campaign performance, publishing frequency, or engagement trends across several months.
The value here depends heavily on the platform's historical-data capabilities.
Before choosing a third-party TikTok analytics tool, find out:
- How much historical data it stores.
- When data collection begins.
- Whether historical data is imported.
- How frequently data is refreshed.
- Whether historical numbers can change after updates.
A longer historical record can make trend analysis considerably more useful, but only if the underlying methodology remains clear.
Social Media Workflow Management
Analytics are only one part of social media management.
A modern social media workflow can involve creating visual content, writing captions, preparing variations, scheduling posts, publishing them across several networks, and then analyzing the results.
This is where social media management platforms can complement analytics tools.
For example, Bibby combines content creation, AI-assisted caption generation, scheduling, publishing, and multi-platform social management in one workflow. Its conversational interface also allows users to manage tasks such as creating campaigns, posts, and brand assets through chat.
That does not make Bibby a replacement for TikTok's native analytics. Instead, it illustrates an important distinction: the tool used to manage the publishing workflow does not necessarily need to be the authoritative source for measuring platform performance.
For many teams, keeping these roles separate can actually make the overall workflow clearer.
Recurring Reporting and Automation
Another advantage of third-party platforms is reducing repetitive reporting work.
If someone on your team spends hours every month collecting TikTok, Instagram, Facebook, LinkedIn, and YouTube metrics manually, centralized reporting can save considerable time.
That time can then be redirected toward the work that actually improves performance:
- Identifying winning content.
- Testing new formats.
- Improving hooks.
- Adjusting publishing strategies.
- Understanding Audience Behavior.
- Planning future campaigns.
The goal of analytics should not be to produce more spreadsheets. It should be to make better decisions with less unnecessary manual work.
Competitive and Benchmarking Analysis
Some third-party platforms also provide benchmarking features that can help marketers put performance into context.
For example, a brand may want to know whether its engagement rate is improving relative to previous periods or how its performance compares with selected competitors where reliable public data is available.
This can be useful, but competitive analytics should be treated carefully.
A competitor's publicly visible performance does not reveal everything about its strategy, audience quality, paid distribution, conversion performance, or business results.
Benchmarking is therefore best used as context rather than as a definitive measure of success.
The Best Use of Third-Party Analytics
The strongest use case for third-party TikTok analytics is not proving that they are better than TikTok.
It is recognizing that they solve a different problem.
TikTok tells you what happened on TikTok. A good third-party system can help you understand how that performance fits into your broader social media operation.
That distinction becomes especially important when you need to decide when TikTok's native dashboard should override the numbers in an external reporting system.
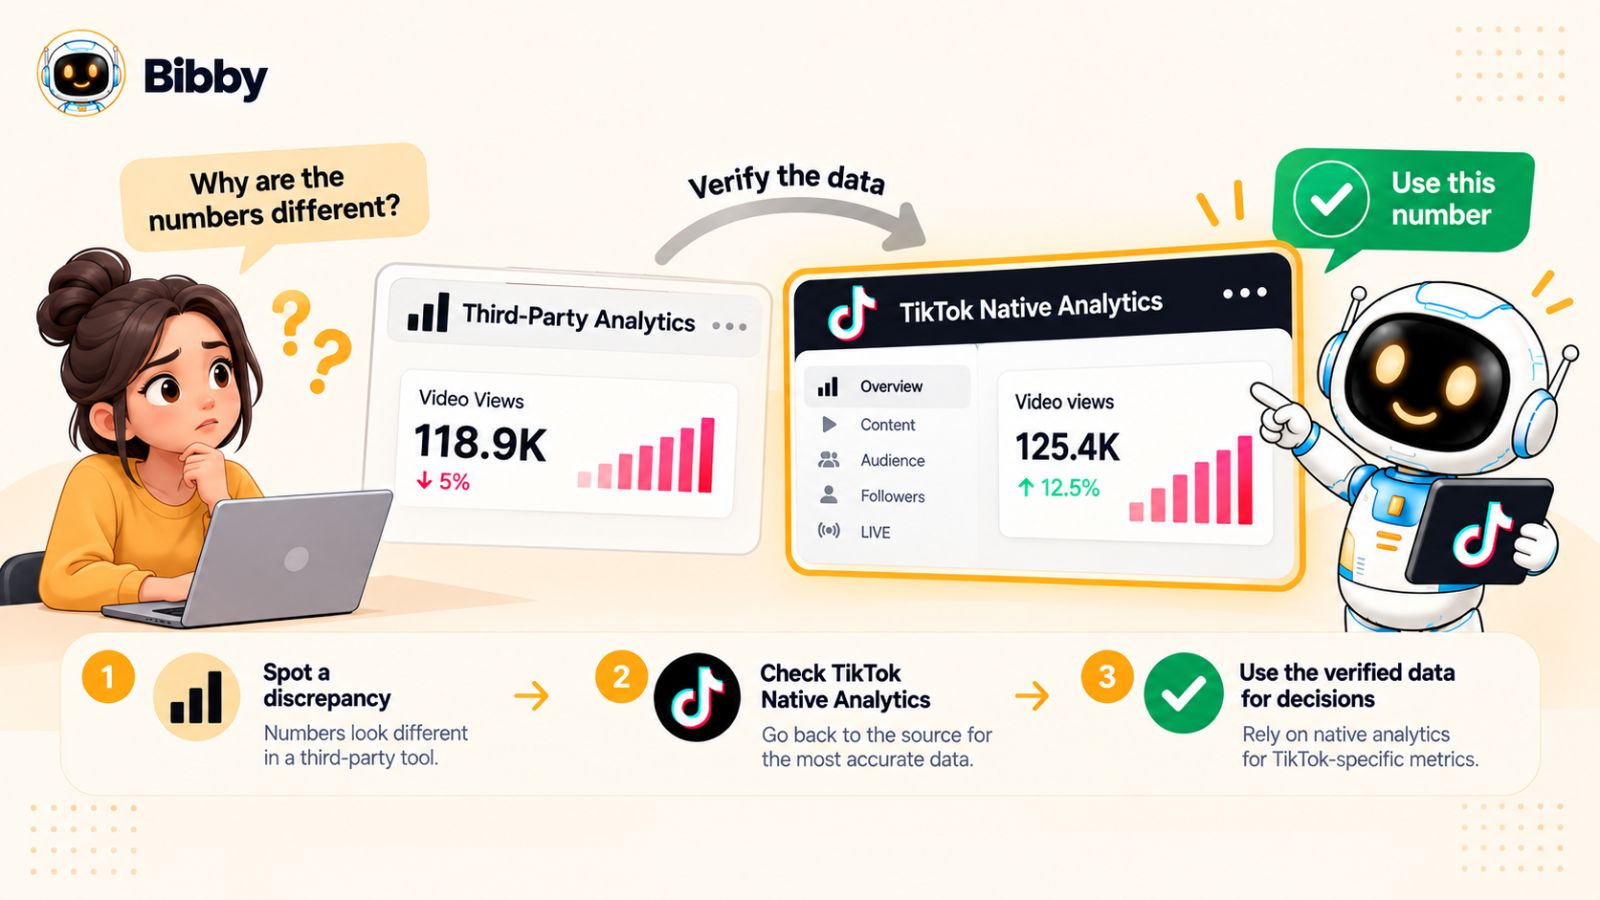
When TikTok Native Analytics Should Be Your Source of Truth
Third-party TikTok analytics can make reporting easier, but there are situations where you should go directly to TikTok's native dashboard before making a decision.
The principle is straightforward: when you need to know exactly how TikTok itself is reporting your content or account, TikTok's native analytics should generally be your source of truth.
This is especially important when a decision depends on a specific TikTok metric rather than a cross-platform comparison.
When Evaluating Individual TikTok Videos
If you want to determine how a particular TikTok video performed, start with TikTok.
You may be investigating why one video received significantly more views than another, why engagement changed, or whether a new content format is producing better results.
Native analytics give you the closest view of the performance information TikTok makes available for that content.
This is particularly useful when making decisions about:
- Video topics
- Hooks
- Formats
- Video length
- Posting patterns
- Calls to action
- Audience response
A third-party dashboard can help organize this information, but TikTok should generally be the first reference when you need to verify the underlying performance.
When Investigating Unexpected Performance
Suppose a video suddenly receives ten times your normal number of views.
Before concluding that your third-party analytics platform has detected a reporting error—or before building a major strategy around the number—check TikTok directly.
The same applies when performance suddenly appears unusually low.
Native analytics can help you determine whether the unusual result is actually visible within TikTok's own reporting environment.
This creates a simple diagnostic process:
Third-party dashboard shows something unusual → check TikTok → investigate the difference → determine whether the discrepancy is analytical or genuine.
When Analyzing TikTok Audience Behavior
If your decision depends on who is watching your content or how your TikTok audience behaves, native TikTok analytics should generally take priority.
Audience data is inherently platform-specific.
The people interacting with your TikTok account are not necessarily representative of your Instagram, LinkedIn, Facebook, or YouTube audiences.
A third-party dashboard may be useful for viewing audience information across several platforms, but you should not assume that a standardized demographic category means exactly the same thing everywhere.
For TikTok-specific audience decisions, start with TikTok.
When Checking Recent Performance
Fresh data deserves particular caution.
Third-party platforms can have reporting delays, depending on how frequently they retrieve and process data.
If a post was published recently and you want to know how it is performing right now, TikTok's native dashboard is generally the better place to check first.
This is especially relevant when you are making rapid decisions about a current campaign.
A few hours of reporting delay can make a significant difference when a video is actively gaining traction.
When Verifying a Client or Executive Report
If an important report contains a TikTok-specific figure that is being questioned, go back to the native source.
This does not mean you have to abandon the third-party reporting system you use for routine reporting.
Instead, it gives your team a verification process.
For example:
Third-party report → identify questionable metric → check TikTok native analytics → confirm reporting period and definition → document the final figure.
This is much more reliable than assuming whichever dashboard has the most convenient interface must be correct.
When TikTok and a Third-Party Tool Disagree Significantly
Small discrepancies can be normal.
Large, persistent discrepancies deserve investigation.
If TikTok reports substantially different performance from your third-party analytics platform, check the following before using either figure:
- Are the date ranges identical?
- Are both systems using the same time zone?
- Was the third-party data recently refreshed?
- Is the metric defined the same way?
- Does the third-party platform calculate the metric?
- Is any content missing?
- Does the external platform have historical-data limitations?
- Is the account connection working correctly?
If the discrepancy remains after these checks, TikTok's native figure should generally take priority for a TikTok-specific metric.
When Making TikTok Content Decisions
Analytics only become valuable when they influence action.
If your goal is to improve TikTok content, native analytics can provide the platform-specific feedback needed to refine your strategy.
For example, you might discover that shorter videos consistently retain viewers longer, that certain topics generate more shares, or that particular content formats produce more profile activity.
These insights can then influence your future publishing strategy.
A social media management platform can help you execute that strategy by making content creation and publishing more efficient, but the performance feedback should still come from appropriate measurement sources.
Native Data Should Anchor, Not Isolate, Your Reporting
Treating TikTok as the source of truth does not mean ignoring every other analytics platform.
In fact, using both sources can produce a stronger system.
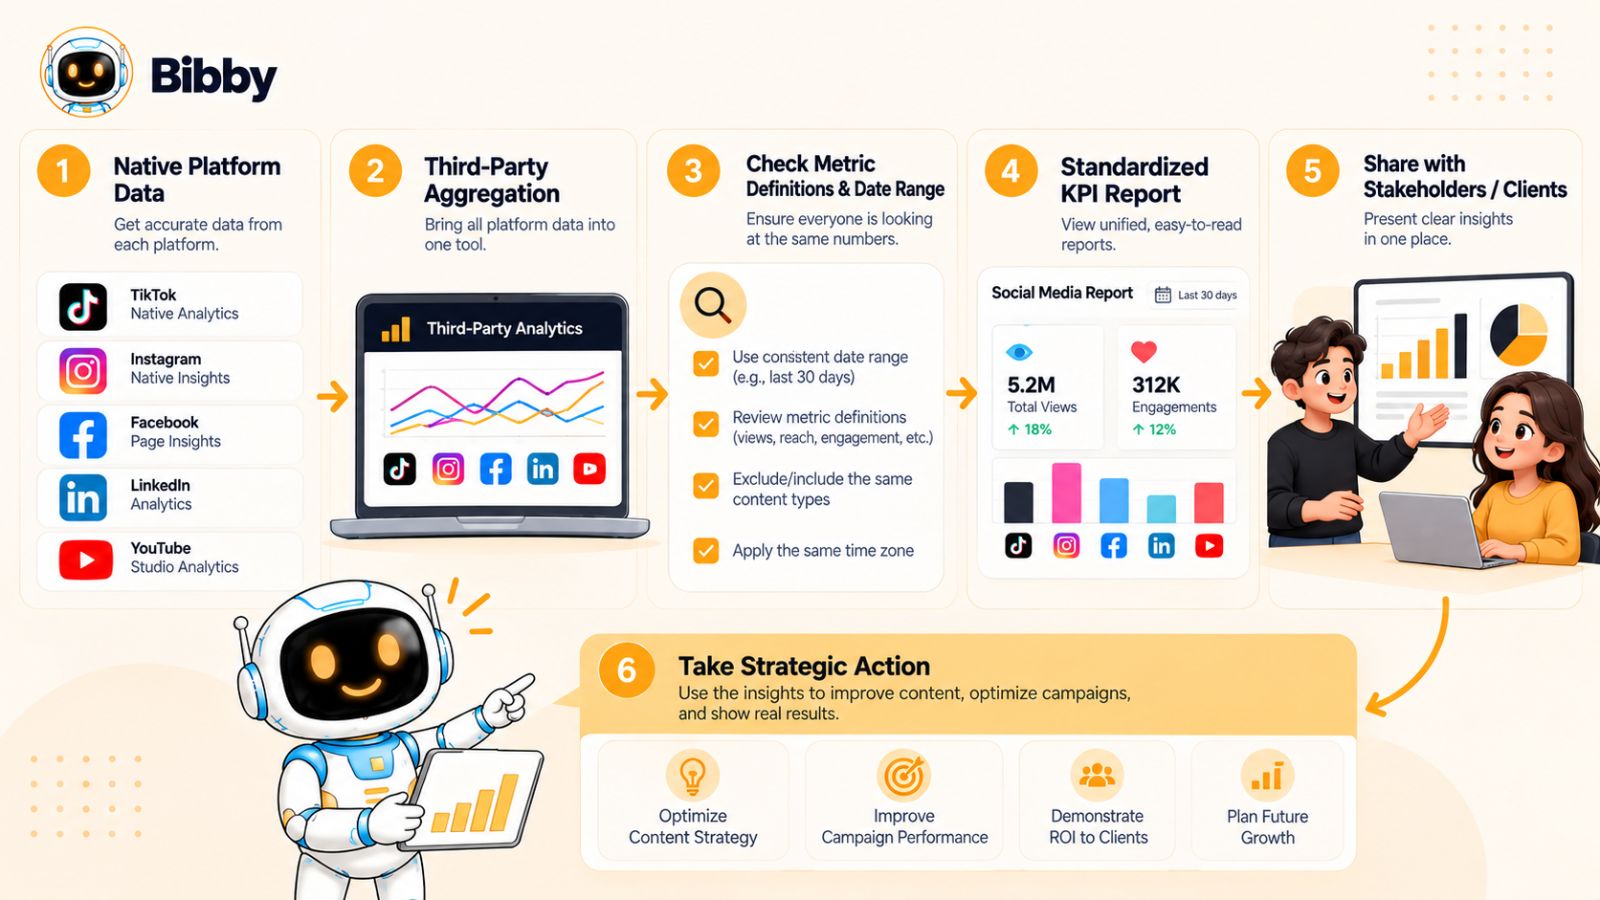
TikTok can provide the platform-specific measurement. A third-party platform can organize that information alongside other channels and help you identify broader patterns.
The important thing is to establish a hierarchy:
Native TikTok data answers: “What happened on TikTok?”
Third-party analytics answers: “How does that performance fit into the broader social media picture?”
Once that hierarchy is established, there is much less reason to argue about which dashboard is universally better.
The next challenge is turning that principle into a reliable reporting process that your entire team can follow consistently.
How to Build a Reliable TikTok Analytics Workflow
Knowing which TikTok analytics source to trust is only useful if your team has a consistent process for collecting and interpreting the data.
Without a defined workflow, marketers can easily end up mixing native TikTok metrics with third-party figures, comparing different reporting periods, or switching between formulas without realizing it.
A reliable workflow does not need to be complicated. It needs clear roles for each data source.
Start With TikTok as the Primary Measurement Layer
For TikTok-specific performance, begin with the native dashboard.
Use it to understand how individual content pieces performed, how the account is growing, and how your TikTok audience is interacting with your content.
This creates a reliable foundation before you bring the information into a broader reporting system.
The goal is not to collect every available metric. Focus on the metrics that connect directly to your marketing objectives.
For example, a brand focused on awareness may prioritize views and reach, while a business focused on audience growth may pay more attention to follower growth and profile activity.
Define Your Core TikTok Metrics
Before building reports, decide which metrics actually matter.
A useful TikTok measurement framework might include:
- Views
- Engagements
- Engagement rate
- Shares
- Comments
- Follower growth
- Profile activity
- Watch time
- Retention or completion metrics where available
- Website or conversion outcomes where appropriate
You do not need to track every number TikTok provides.
Tracking too many metrics can actually make reporting less useful because the important signals become harder to identify.
Establish One Reporting Period
Always define the reporting period before comparing numbers.
For example, your team might report TikTok performance from the first through the last day of each calendar month.
Then keep that period consistent across your dashboards.
If you compare a 30-day TikTok report with a 28-day third-party report, the resulting difference may have nothing to do with data accuracy.
The same principle applies to weekly reporting.
A clearly defined reporting period is one of the simplest ways to prevent analytics confusion.
Standardize Your Time Zone
Choose a reporting time zone and use it consistently.
This becomes particularly important for international teams or accounts with audiences across multiple countries.
Daily reporting can become confusing when one system treats a late-night post as belonging to one day while another system assigns the activity to the next.
A consistent time-zone policy makes historical comparisons much easier.
Record When the Data Was Retrieved
Analytics are not necessarily static.
A TikTok video can continue accumulating views and engagement after you initially record its performance.
For important reports, record the date on which the data was collected.
For example:
Reporting period: September 1–30
Data retrieved: October 2
This simple practice makes reports much easier to interpret later.
If someone revisits the same video weeks afterward and sees a higher view count, there is a clear explanation for the difference.
Use Third-Party Analytics for Consolidation
Once the native TikTok data is understood, a third-party platform can provide a broader reporting layer.
This is particularly useful if your business publishes across several networks.
Instead of manually switching between TikTok, Instagram, Facebook, LinkedIn, and YouTube dashboards, your team can use a centralized reporting environment to identify broader patterns.
The important thing is to preserve the distinction between native measurements and third-party calculations.
Do not assume that placing several metrics in the same dashboard makes them directly equivalent.
Keep Publishing and Measurement Connected but Separate
Social media teams often have a workflow that looks something like this:
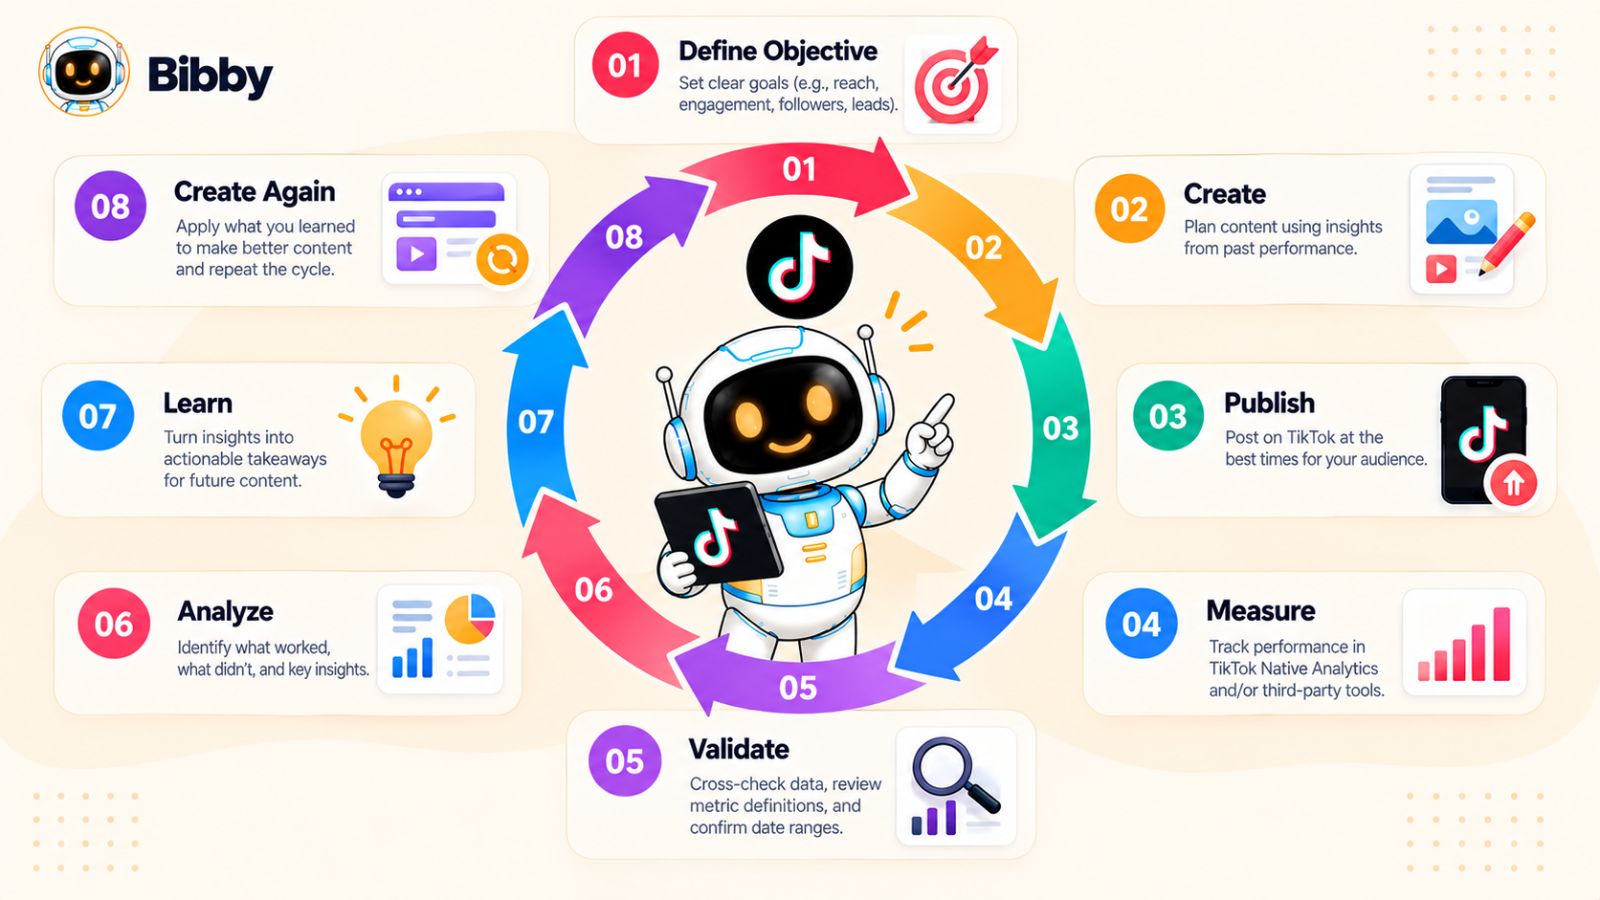
Create → Schedule → Publish → Measure → Learn → Create again
The publishing stage and measurement stage are connected, but they are not the same function.
A platform such as Bibby can help simplify the operational side of that workflow by allowing marketers to create content, generate AI-assisted captions, schedule posts, and publish across multiple social networks.
The analytics stage still needs its own measurement methodology.
This distinction becomes increasingly important as social media teams automate more of their publishing process. Automation can make publishing faster, but it does not automatically make performance data more authoritative.
Create a Discrepancy Policy
Your team should also decide what happens when numbers do not match.
A simple policy might be:
- Check the reporting period.
- Check the time zone.
- Check the metric definition.
- Check the third-party refresh date.
- Check whether the metric is calculated.
- Compare the figure with TikTok's native dashboard.
- Use TikTok's figure as the final reference for TikTok-specific performance when necessary.
- Document significant discrepancies.
This prevents every reporting disagreement from becoming a new debate.
Separate Measurement From Interpretation
Another important practice is separating the number from the meaning you assign to it.
For example:
Measurement: A TikTok video received 250,000 views.
Interpretation: The video's topic may have strong audience appeal.
The first is a data point. The second is a hypothesis.
Keeping that distinction clear helps prevent teams from making major strategic decisions based on one isolated metric.
Turn Analytics Into an Action Loop
The final step is using analytics to improve what you publish next.
A useful workflow is:
Publish → Measure → Identify patterns → Form a hypothesis → Test new content → Measure again
For example, if several videos with strong opening hooks consistently produce better retention, you can test whether that pattern continues with future content.
This is much more valuable than simply collecting monthly analytics reports.
The purpose of a TikTok analytics workflow is not to create a prettier dashboard.
It is to create a repeatable system that turns performance data into better content decisions.
With that system in place, you can also avoid the most common mistakes marketers make when comparing third-party TikTok analytics with the native dashboard.
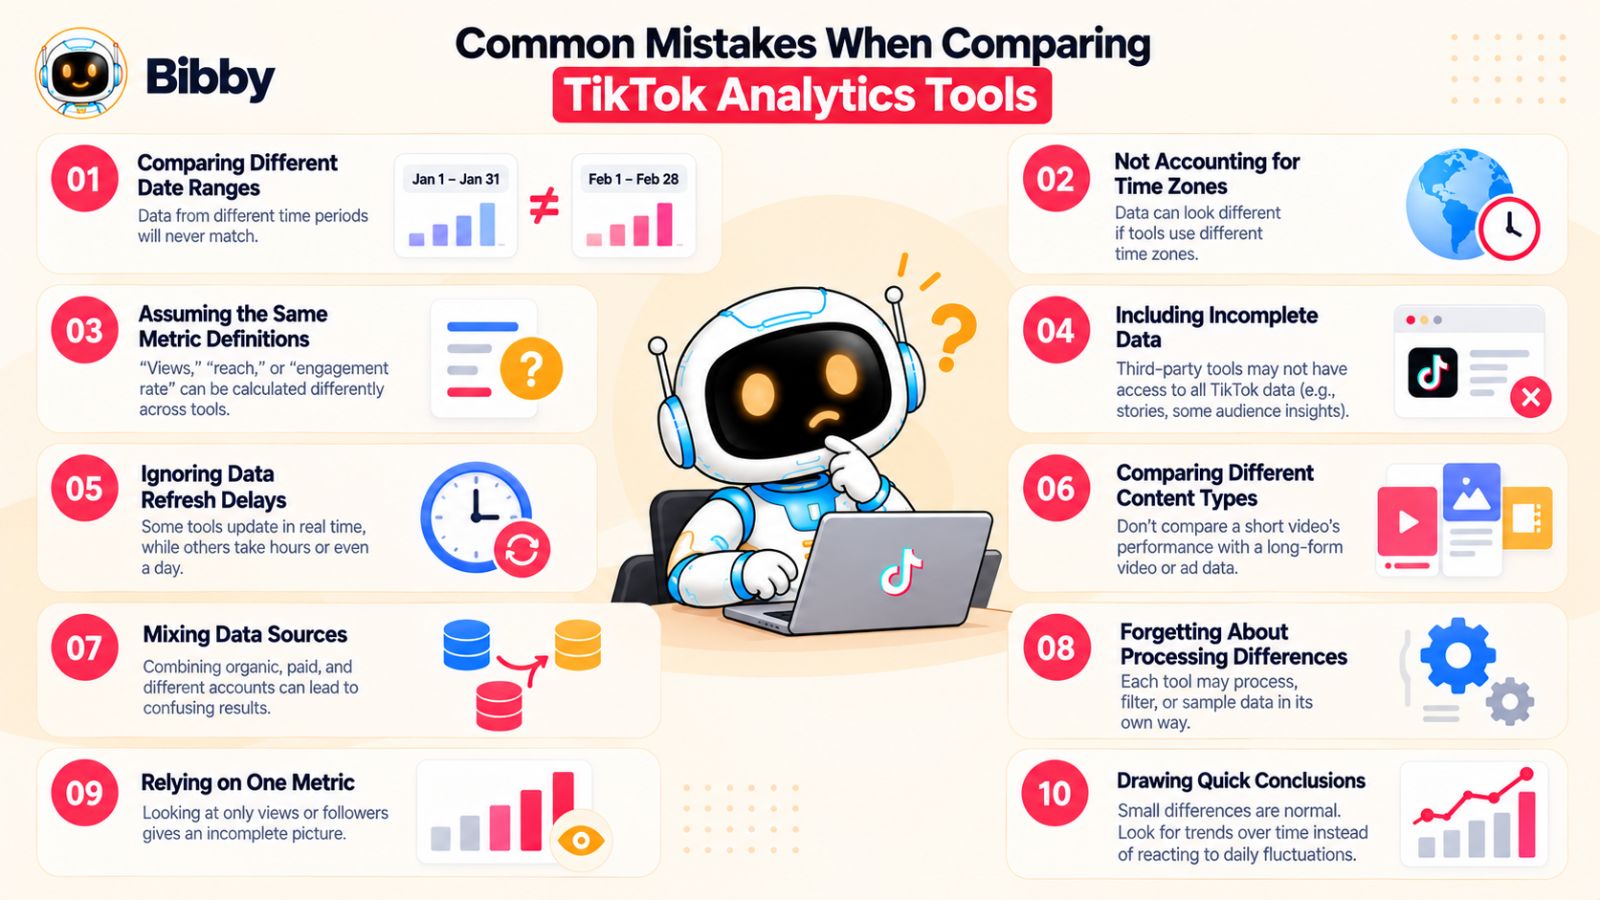
Common Mistakes When Comparing TikTok Analytics Tools
Comparing TikTok's native dashboard with a third-party analytics platform sounds straightforward until you start seeing different numbers.
Most mistakes happen because marketers compare metrics without first checking whether the underlying data, definitions, and reporting conditions are actually the same.
Avoiding these mistakes can make your reporting significantly more reliable.
Assuming Every Dashboard Should Show Identical Numbers
The biggest mistake is expecting TikTok and every third-party platform to display exactly the same figures.
They may use different refresh schedules, data sources, formulas, or reporting conventions.
A small discrepancy does not automatically indicate inaccurate data.
Instead of asking why two numbers are identical or different, ask whether they are measuring the same thing under the same conditions.
Comparing Different Date Ranges
A surprisingly common error is comparing reports with different start or end dates.
For example, a TikTok report covering October 1–31 cannot be fairly compared with a third-party report covering October 1–30.
Always verify the reporting period before investigating a discrepancy.
This is especially important when reviewing fast-growing accounts where one additional day can significantly affect the totals.
Ignoring Time Zones
Time-zone differences can affect daily and weekly reporting.
This is particularly relevant for brands with international audiences or teams working across different countries.
If your TikTok dashboard and third-party platform use different time zones, activity around midnight can appear under different reporting dates.
Standardizing the reporting time zone prevents many unnecessary discrepancies.
Treating Reach and Impressions as the Same Metric
Reach and impressions are often confused.
Reach generally refers to unique users exposed to content, while impressions refer to the number of times content was displayed.
The exact definitions can vary by platform, so marketers should always check the specific definitions being used.
Do not compare a TikTok reach figure with a third-party impression figure and assume the larger number represents better performance.
They answer different questions.
Comparing Engagement Rates Without Checking the Formula
Engagement rate is particularly dangerous for cross-platform comparisons because there is no universal calculation that every analytics platform uses.
One tool may calculate engagement based on views.
Another may use reach.
Another may use followers.
If you compare percentages without checking the denominator and included interactions, you may draw completely incorrect conclusions.
For recurring reporting, document the formula your team uses and keep it consistent.
Treating Third-Party Estimates as Official TikTok Data
Some analytics platforms may provide estimated, modeled, calculated, or normalized metrics.
Those numbers can still be useful.
The problem occurs when marketers present them as though they were directly reported by TikTok.
If a metric is calculated by your analytics provider, label it accordingly.
This is particularly important in client presentations and executive reports where people may assume every number comes directly from the social platform.
Checking Data Too Soon After Publishing
Fresh TikTok content can continue accumulating views and engagement rapidly.
If you compare TikTok's native dashboard with a third-party platform immediately after publication, the two systems may be working from different data snapshots.
Give reporting systems enough time to update before concluding that there is a meaningful discrepancy.
For real-time decisions, TikTok's native dashboard is generally the better starting point.
Using One Metric to Judge Content
A video with the most views is not necessarily your best video.
Consider a simple example.
One TikTok receives 500,000 views but produces very little engagement or profile activity.
Another receives 100,000 views but generates substantially more comments, shares, profile visits, or conversions.
Which one is better?
The answer depends on the objective.
This is why strong TikTok analysis looks at multiple signals rather than treating views as the final score.
Mixing Native and Third-Party Numbers Without Labeling Them
A report might contain TikTok views from the native dashboard, engagement rates calculated by a third-party platform, and follower data exported at a different time.
Individually, these numbers may be valid.
Together, however, they can create a confusing measurement system if the sources are not documented.
For important reports, identify the source and reporting date for your key metrics.
Choosing a Tool Because Its Dashboard Looks Better
A polished analytics dashboard can be useful, but appearance should not be the primary reason you choose an analytics platform.
Before adopting a tool, investigate:
- Where its data comes from.
- Which TikTok metrics it supports.
- How frequently data refreshes.
- How historical data is handled.
- Which metrics are calculated.
- How formulas are defined.
- How data can be exported.
- Whether it supports the other platforms your team uses.
A beautiful dashboard with unclear methodology is less useful than a simpler dashboard with transparent data practices.
Confusing Social Media Management With Analytics
Another common mistake is assuming that the platform you use to schedule and publish content must also be the best source for measuring its performance.
These are related but different functions.
A social media management platform can make content creation, scheduling, publishing, and campaign management easier. A dedicated analytics system can provide deeper reporting and analysis. And the native TikTok dashboard can remain the authority for TikTok-specific measurements.
Tools such as Bibby can be valuable for reducing the operational work involved in managing social media across platforms, but publishing automation and analytics authority should not be treated as the same thing.
Focusing on Data Collection Instead of Decisions
The final mistake is perhaps the most important.
It is easy to spend hours collecting views, likes, engagement rates, follower counts, and other metrics without actually changing your content strategy.
The purpose of analytics is to answer questions and improve decisions.
If your reporting tells you that certain topics consistently attract stronger engagement, test more of those topics.
If certain hooks improve retention, investigate why.
If a platform generates large amounts of attention but little meaningful business activity, examine whether your content strategy needs to change.
Good analytics should reduce uncertainty and improve your next decision—not simply give you more numbers to look at.
Once these mistakes are avoided, choosing a third-party TikTok analytics platform becomes much easier because you can evaluate tools based on what they actually contribute to your workflow.
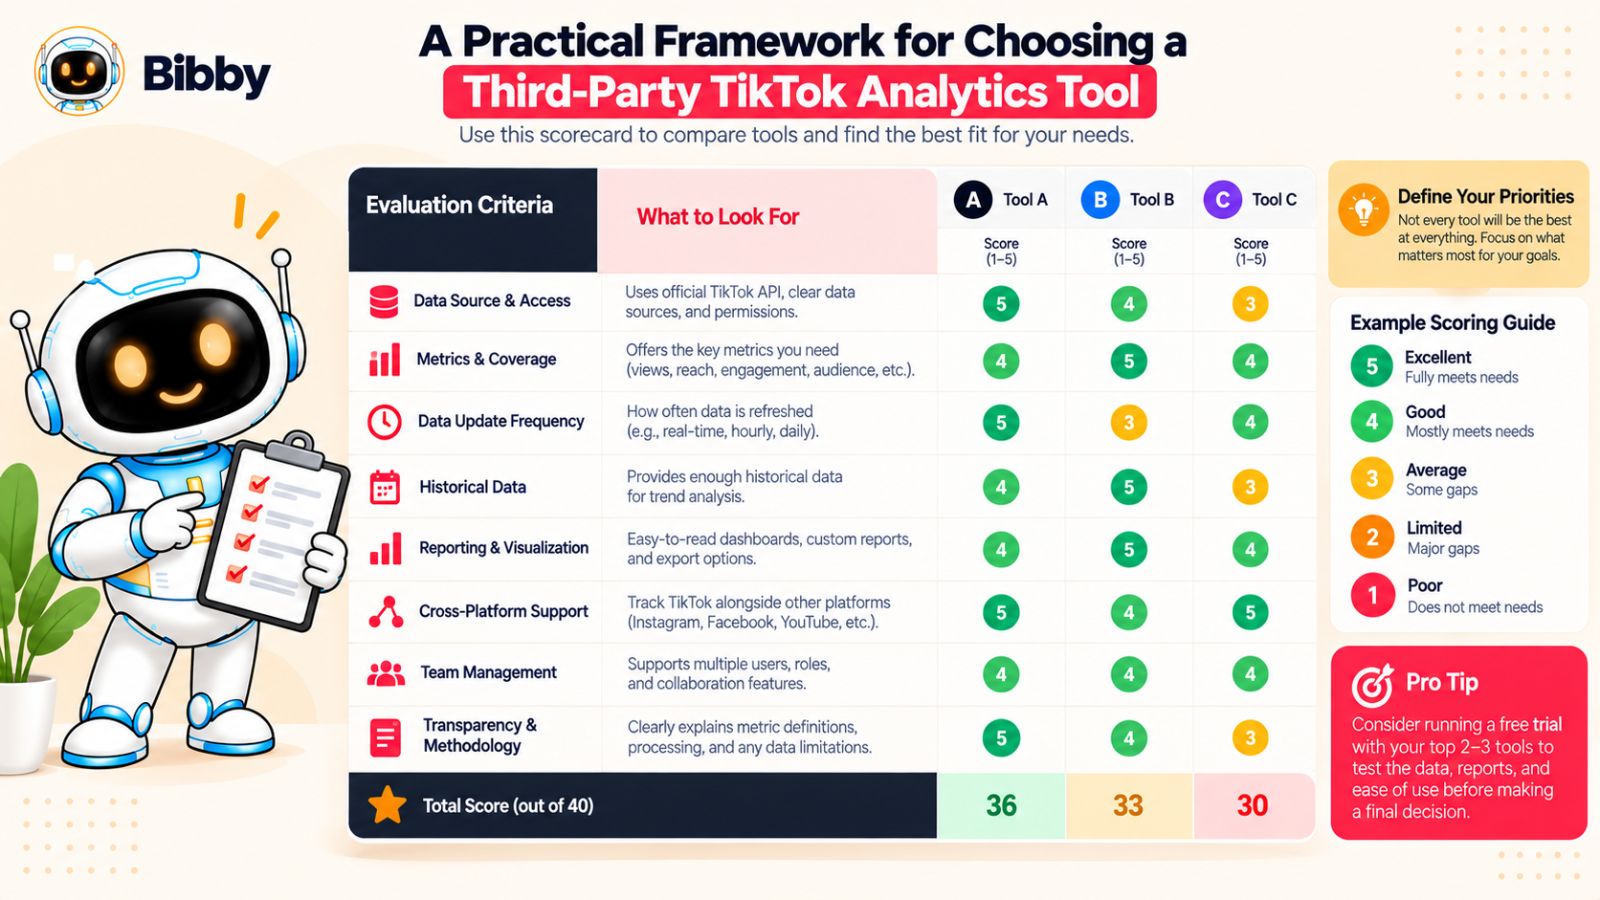
How to Choose a Third-Party TikTok Analytics Tool
The right third-party TikTok analytics tool is not necessarily the one with the largest number of features or the most impressive dashboard.
The better choice is the platform that gives you reliable enough data for your decisions, makes reporting easier, and fits the way your social media team actually works.
Before choosing one, evaluate the following areas.
Check Where the Data Comes From
Start with the most important question: where does the platform get its TikTok data?
Look for clear information about its TikTok integration, supported data sources, and API access.
A provider that explains its data methodology is easier to evaluate than one that simply displays numbers without explaining how they were collected.
You should also determine which metrics come directly from TikTok and which ones are calculated by the third-party platform.
Check Which Metrics Are Actually Supported
Do not choose an analytics platform based only on the number of metrics listed on its feature page.
Instead, identify the metrics your team actually needs.
For example, you may care most about:
- Video views
- Engagement
- Engagement rate
- Shares
- Comments
- Follower growth
- Audience information
- Watch time
- Retention
- Profile activity
- Conversion-related reporting
Then confirm that the platform supports those metrics for TikTok specifically.
A platform may support a metric for Instagram or Facebook without offering the same metric for TikTok.
Understand the Update Frequency
Find out how often the platform refreshes TikTok data.
This matters if your team uses analytics for real-time or near-real-time decision-making.
A platform that updates once per day may be perfectly adequate for monthly reporting but less useful when you are monitoring an active campaign.
The right refresh frequency depends on your use case.
Investigate Historical Data
Historical data is particularly important when you want to analyze long-term trends.
Ask:
- How far back does the platform go?
- Does it import historical data?
- Does it start collecting data only after account connection?
- Can historical figures change?
- How does it handle deleted content?
A tool with limited historical coverage may still be useful, but you should know the limitation before building reports around it.
Check How Metrics Are Calculated
If the platform provides derived metrics such as engagement rate, growth rate, or performance scores, find out how they are calculated.
This matters because two analytics platforms can produce different percentages from the same underlying data.
Transparent formulas make it easier to compare reports and explain results to stakeholders.
If you cannot determine how an important metric is calculated, be cautious about using it as a primary performance indicator.
Look at Cross-Platform Reporting
If your team manages more than TikTok, examine how well the platform handles other social networks.
A third-party analytics tool becomes considerably more useful when it can help you understand your entire social media ecosystem.
Look for features such as:
- Multi-platform dashboards
- Cross-platform comparisons
- Campaign reporting
- Content comparisons
- Custom date ranges
- Automated reports
- Export options
- Team access
The goal is not simply to put five dashboards into one screen.
The goal is to make meaningful comparisons easier while preserving the differences between each platform's metrics.
Evaluate Reporting and Export Options
Reporting needs can change as a business grows.
A solo creator may only need a dashboard.
An agency may need automated client reports.
A larger marketing team may need exports, scheduled reports, custom views, or integrations with other business systems.
Consider who will actually consume the analytics and how frequently reports need to be produced.
A tool that saves several hours of recurring reporting work can provide more value than one that offers dozens of rarely used metrics.
Consider the Publishing Workflow
Analytics do not exist separately from the rest of your social media operation.
Your team may need to move from content planning to creation, scheduling, publishing, and measurement.
Some social media management platforms combine several of these functions.
For example, Bibby is designed around a broader workflow in which users can upload or generate visuals, create AI-assisted captions, choose a publishing style, and schedule content across supported social networks.
That type of platform can reduce the operational work around publishing, even though TikTok's native analytics may still remain the preferred source for validating TikTok-specific performance.
The important question is whether you need analytics only or a broader social media management workflow.
Consider Team and Account Requirements
A tool that works well for one account may become difficult to manage when you add more brands, clients, or team members.
Consider:
- Number of TikTok accounts supported
- Number of users
- Permissions
- Client access
- Approval workflows
- Report sharing
- Account security
- Multi-brand management
These factors can become more important than individual analytics features as your operation grows.
Do Not Ignore Data Transparency
A good third-party analytics provider should make it reasonably easy to understand what its numbers mean.
Before relying on a platform, look for documentation explaining:
- Data sources
- Metric definitions
- Update frequency
- Historical-data limitations
- API limitations
- Calculated metrics
- Reporting methodology
The clearer the methodology, the easier it becomes to explain discrepancies when someone asks why a third-party figure differs from TikTok.
Choose Based on the Decision You Need to Improve
Ultimately, the best third-party TikTok analytics tool is the one that helps you make better decisions.
If you only need to understand how individual TikTok videos perform, TikTok's native dashboard may already provide much of what you need.
If you manage multiple social networks, clients, campaigns, or large volumes of content, a third-party platform may provide substantially more value.
And if your biggest problem is not analytics but the amount of time spent creating and publishing content, a broader social media management platform may solve a different—and potentially more important—problem.
The right tool is therefore determined by the workflow around your data, not by the number of features listed on a product page.
Once you apply this framework, the original question—third-party TikTok analytics vs native dashboard—becomes much easier to answer.
Third-Party TikTok Analytics vs Native Dashboard: Final Verdict
So, which should you trust: third-party TikTok analytics or the native TikTok dashboard?
For most marketers, the answer is both—but for different purposes.
TikTok's native analytics should generally be your primary source when you need to understand and verify TikTok-specific performance. Third-party analytics become more valuable when you need to organize that information, compare it with other social networks, create recurring reports, or manage a larger social media operation.
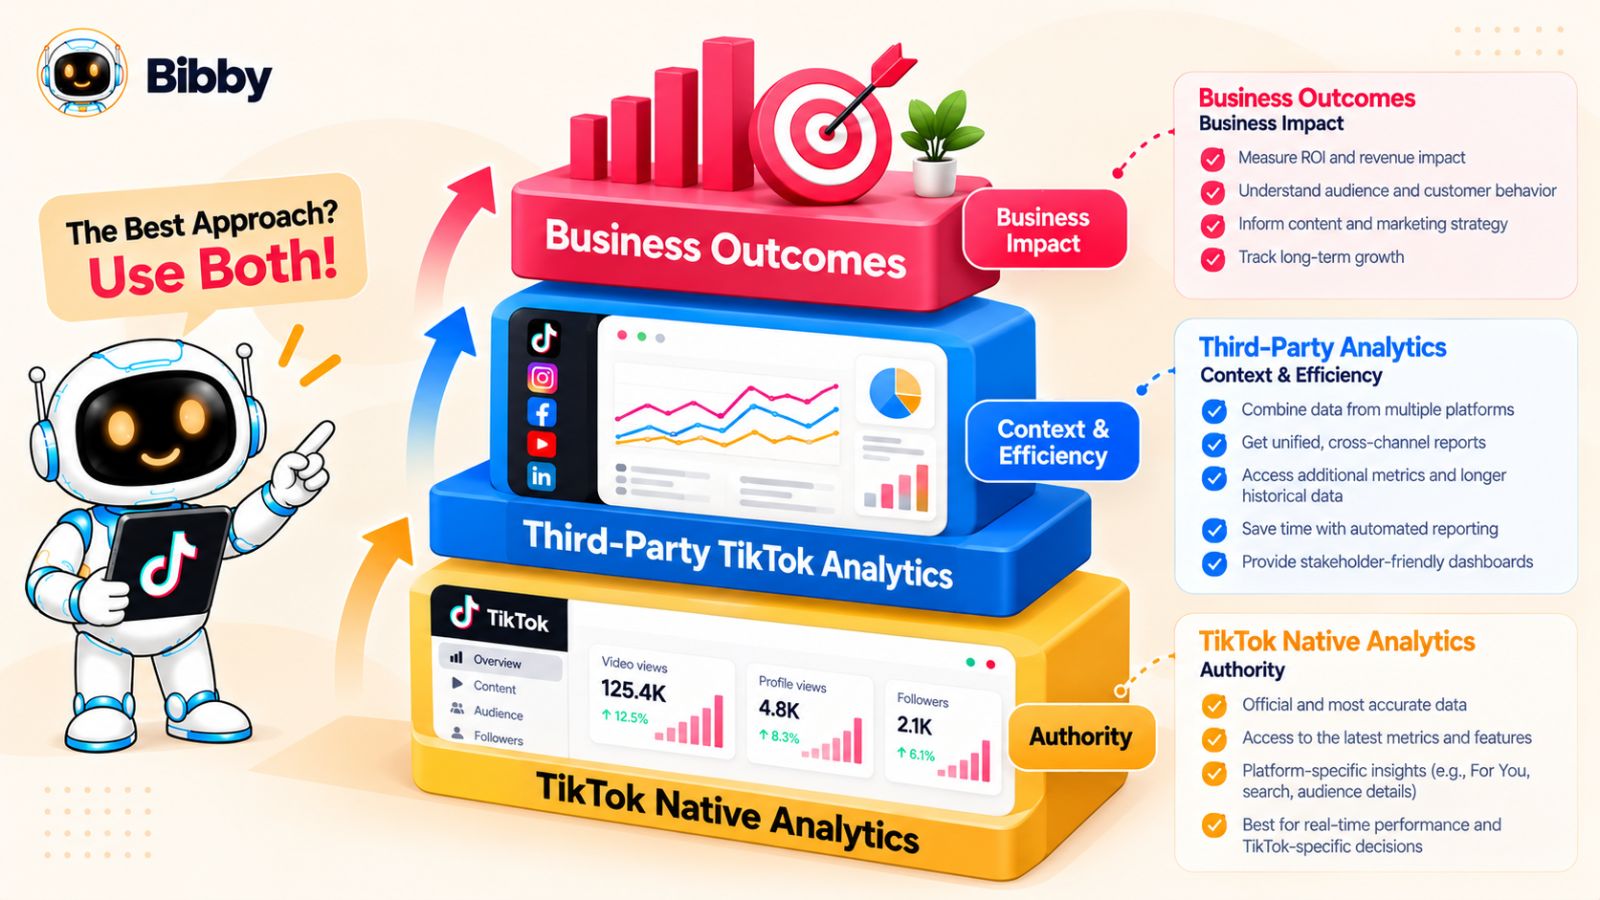
TikTok Native Analytics Should Be Your Measurement Authority
When you need to know what happened to a specific TikTok video or account, start with TikTok.
Use the native dashboard to validate important figures such as content performance, engagement, audience information, and other TikTok-specific metrics available to your account.
This is especially important when another analytics platform reports a substantially different number.
Instead of immediately deciding that one tool is inaccurate, check the reporting period, refresh time, metric definition, and data source. If the discrepancy remains and you need an authoritative TikTok-specific figure, the native dashboard should generally take priority.
Third-Party Analytics Should Add Context
Third-party analytics are not inherently less valuable because they are external.
Their biggest advantage is that they can solve problems TikTok's native dashboard is not designed to solve.
They can help teams:
- Compare multiple social networks.
- Consolidate reporting.
- Analyze longer-term trends.
- Manage multiple accounts.
- Build recurring reports.
- Identify cross-platform content patterns.
- Reduce manual reporting work.
That broader context can be extremely valuable for businesses that treat social media as a connected marketing channel rather than a collection of isolated platforms.
Use a Source-of-Truth Hierarchy
The simplest way to avoid analytics confusion is to establish a hierarchy.
For TikTok-specific measurement, use TikTok's native analytics as the primary reference.
For cross-platform reporting and analysis, use a reputable third-party analytics platform while documenting its methodology.
For content creation, scheduling, and publishing, use the social media management tools that best fit your workflow.
These roles do not need to belong to one platform.
For example, a team might use Bibby to streamline content creation, AI-assisted captions, scheduling, and publishing across its social channels, while using TikTok's native analytics to validate TikTok performance and a reporting platform to analyze broader social trends.
That is not an inefficient setup. It is a recognition that different tools can solve different parts of the social media workflow.
Don't Chase Perfectly Matching Numbers
One of the most important lessons from comparing TikTok analytics tools is that perfect numerical agreement is not always the goal.
What matters is whether the data is:
- Relevant to the question.
- Defined clearly.
- Collected consistently.
- Reported within the correct time period.
- Reliable enough for the decision being made.
A small discrepancy between dashboards may have no meaningful impact on your strategy.
A large unexplained discrepancy might.
The difference is understanding the reason behind the number rather than simply choosing whichever dashboard looks more convincing.
The Best Approach Is to Use Both Intentionally
The strongest social media analytics workflow does not require you to choose between native and third-party reporting.
Instead, use each where it provides the most value.
Use TikTok's native dashboard to understand TikTok.
Use third-party analytics to understand TikTok in context.
That approach gives you the platform-level accuracy of native reporting while preserving the efficiency and broader perspective that third-party analytics can provide.
The result is a more reliable measurement system—and, more importantly, a better foundation for deciding what to publish next.
Final words
When comparing third-party TikTok analytics vs native dashboard data, the most important lesson is that you do not have to choose one source for everything.
TikTok's native analytics should generally be your source of truth for TikTok-specific performance, while third-party analytics can make cross-platform reporting, historical analysis, and social media management more efficient. And when numbers differ, the discrepancy does not automatically mean one platform is wrong—check the metric definition, reporting period, refresh time, and data source first.
The three key takeaways are simple:
- Use TikTok's native data for TikTok-specific performance verification.
- Use third-party analytics for broader reporting and cross-platform context.
- Evaluate discrepancies based on methodology, not just different numbers.
The natural next step is to create a social media measurement framework that defines which metrics you track, which platform is the source of truth, and how you compare performance across TikTok, Instagram, Facebook, LinkedIn, and YouTube. That framework can turn disconnected dashboards into a consistent system for making better content and marketing decisions.