
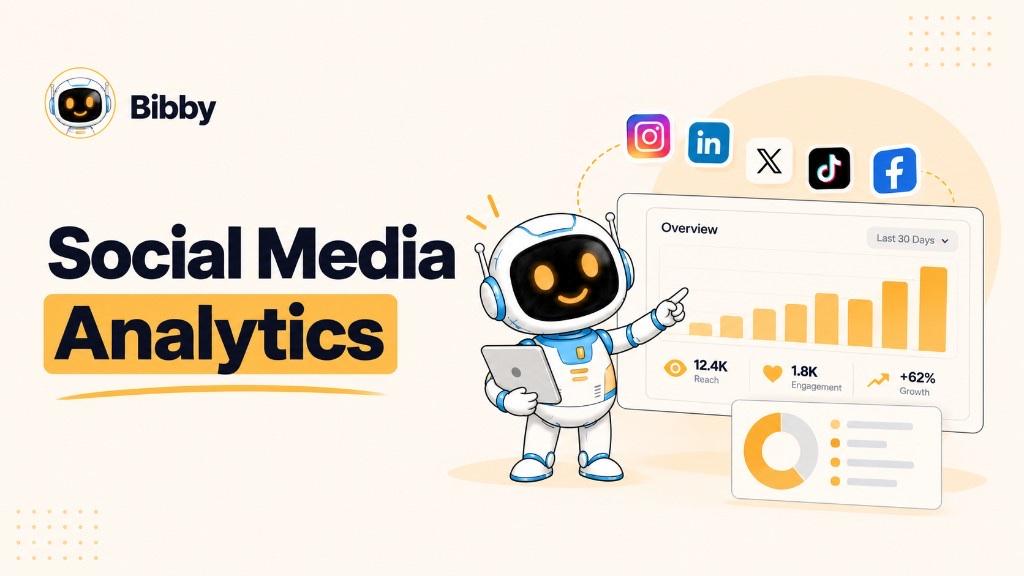
It turns raw numbers such as likes, comments, shares, reach, impressions, clicks, and conversions into insights that can guide better social media decisions.
For example, knowing that an Instagram post received 10,000 views is a social media metric. Understanding that short educational videos consistently generate more views, shares, and profile visits than promotional posts is social media analytics. The first tells you what happened; the second helps explain what it means and what you should do next.
Businesses use analytics to evaluate content, understand audiences, measure campaigns, compare platforms, and see which activities contribute to traffic, leads, sales, or brand growth. Analysis can happen in native Insights on Facebook, Instagram, LinkedIn, TikTok, and YouTube, or in dedicated analytics tools. Bibby does not replace those dashboards.
In this guide, we'll look at what social media analytics means, how it works, key metrics and types, how it differs from social listening and reporting, and how to turn findings into a publishing workflow.
What Is Social Media Analytics?
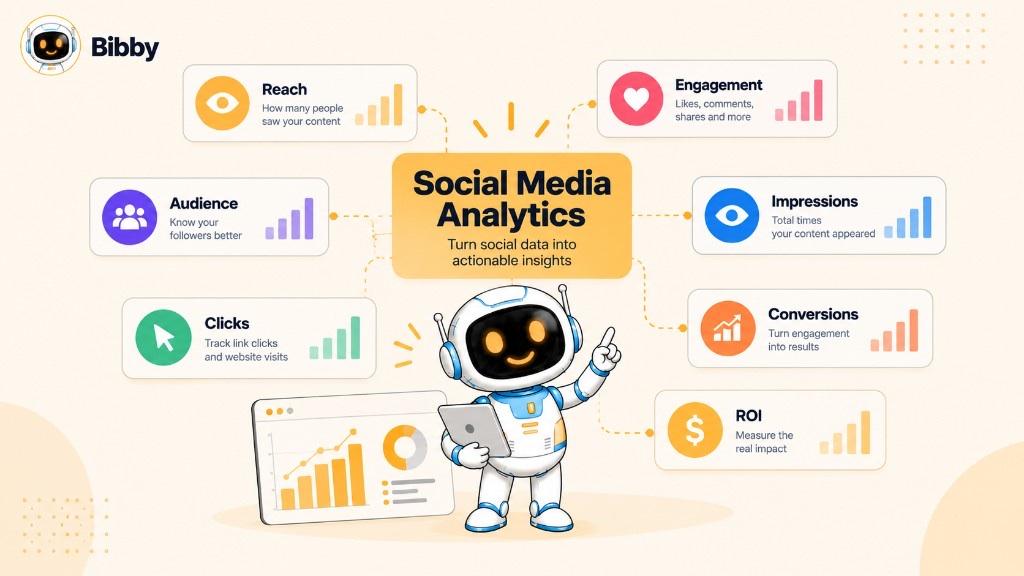
Social media analytics is the process of gathering, organizing, measuring, and interpreting data generated by social media activity. It helps businesses understand what is happening across their channels, how audiences respond, and which activities support marketing and business objectives.
Every interaction can produce data: likes, comments, shares, saves, clicks, views, follower changes, watch time, or campaign conversions. Analytics brings that information together so you can look for patterns—not just collect a spreadsheet.
The important word is analysis. Collecting numbers is not enough. The value comes from interpreting those numbers in context.
Suppose a brand publishes 20 Instagram posts in a month. One post reaches 50,000 people while the others average 8,000. Analytics can help investigate what made that post different: format, topic, hook, shares, or timing. That insight can then influence the next content calendar.
Social Media Analytics in Action
The basic process is:
Social Media Activity → Data → Analysis → Insights → Decisions → Improved Strategy
A dashboard may tell you that engagement increased by 25%. Analytics asks:
- What caused the increase?
- Which content contributed?
- Which audience responded?
- Was the change consistent or temporary?
- Did higher engagement lead to business results?
- What should be repeated or changed?
Analytics can operate at the post, campaign, account, and business levels. Data can also include audience demographics, traffic sources, video retention, sentiment, competitor benchmarks, and historical trends—usually in Insights, ads, or analytics products, not in a scheduler.
Ultimately, analytics turns social data into actionable knowledge: why something performed, for whom, and what to do next.
Social Media Analytics in Simple Terms
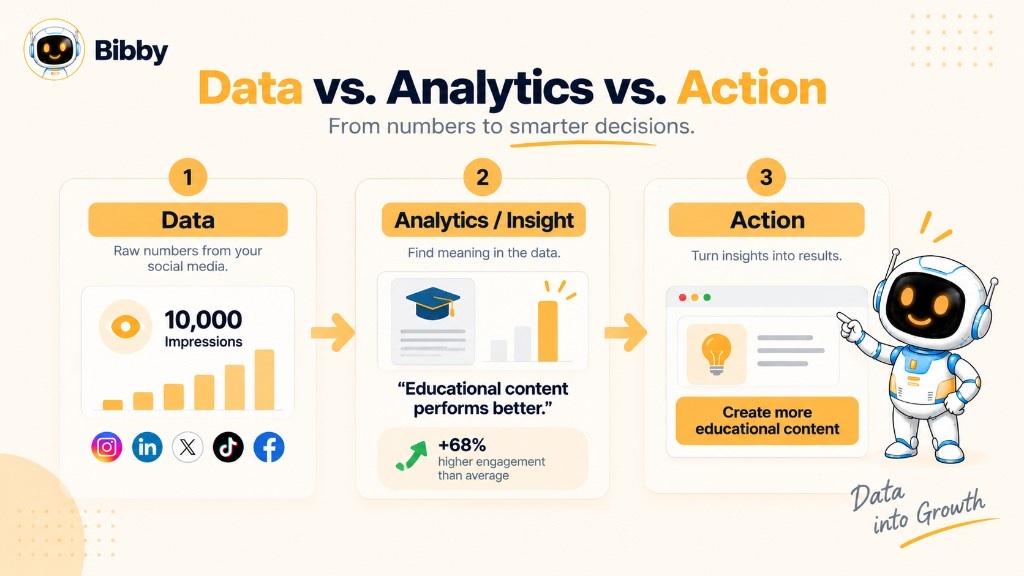
In simple terms, social media analytics helps you understand what is happening on your accounts and why.
A useful frame is three questions.
1. What happened?
Look at the numbers: views, shares, engagement rate, follower growth, website visits. These describe events. They do not automatically explain significance.
2. Why did it happen?
This is where analysis starts. You might find that educational videos earn more views than promotional clips, carousels earn more saves, one topic attracts comments, or one platform drives more traffic.
3. What should you do next?
If educational carousels consistently perform, create more of them. If LinkedIn produces more qualified traffic, give that channel more of the right content. Then measure again:
Measure → Understand → Act → Measure Again
A Simple Example
Post A: 10,000 impressions, 150 engagements, 20 website clicks
Post B: 7,000 impressions, 400 engagements, 85 website clicks
Impressions alone make Post A look stronger. Analytics tells a more useful story: Post B generated more interaction and traffic with less exposure. Investigate topic, format, and call to action before deciding what to repeat.
The objective is not the biggest spreadsheet. It is information that improves content, audiences, campaigns, and decisions.
How Does Social Media Analytics Work?
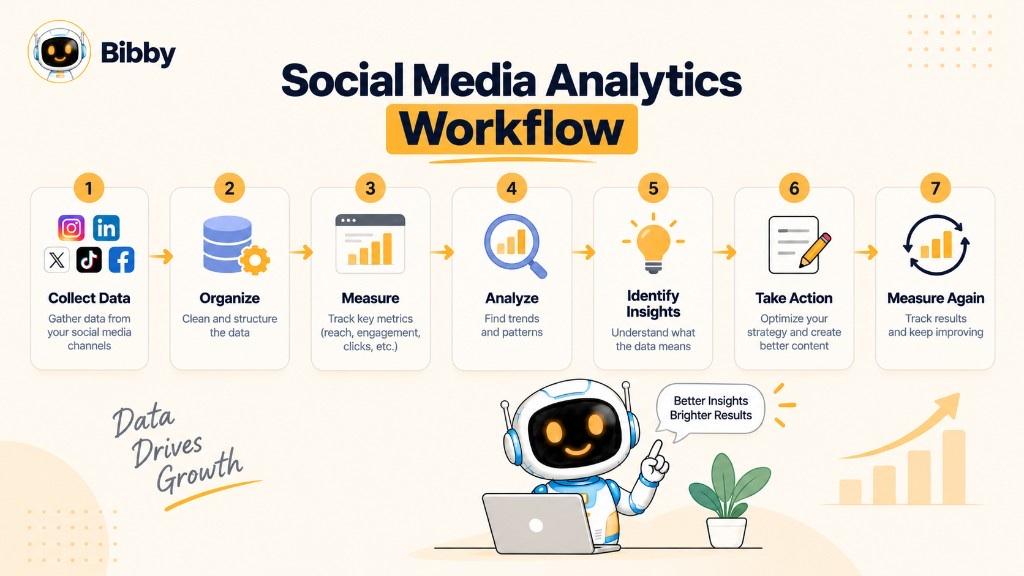
The process generally moves from collection to measurement, analysis, interpretation, and action.
1. Collect Social Media Data
Depending on the platform, data can include reactions, comments, shares, saves, impressions, reach, views, watch time, clicks, follower growth, profile visits, website traffic, conversions, and audience information.
Collect it from native Insights or from a dedicated analytics tool that connects multiple networks. Bibby is not that collection layer.
2. Organize the Data
Group results by platform, account, date, campaign, format, post, topic, audience, and organic versus paid activity so comparisons are possible.
3. Measure Key Metrics
Match KPIs to the goal. Awareness work may emphasize reach and impressions. Engagement work may emphasize comments, shares, saves, and engagement rate. Demand work may emphasize clicks, CTR, conversions, and revenue.
A high impression count does not automatically mean a lead campaign succeeded.
4. Identify Patterns and Trends
Look for formats, topics, platforms, and times that repeat—not just one viral post. Trends over several weeks are stronger evidence than a single spike.
5. Interpret the Results
A reach jump could come from a strong post, a campaign, a format change, paid promotion, or an external event. Compare against previous periods and objectives before assigning a cause.
6. Turn Insights Into Decisions
Insights can change what you create, where you publish, how often you publish, and which campaigns you continue. If educational carousels consistently drive qualified traffic, increase that share of the mix.
7. Measure the Results Again
Collect → Organize → Measure → Analyze → Act → Measure Again
After you change the strategy, new posts create new data. Review that data in Insights. Then schedule the next test with Bibby if you need a publishing workflow.
Analytics Is More Than a Dashboard
A dashboard makes data easier to see. Analysis is connecting points, finding patterns, and deciding what to do.
Data tells you what happened. Analytics helps explain why it happened and what to do next.
What Does Social Media Analytics Measure?
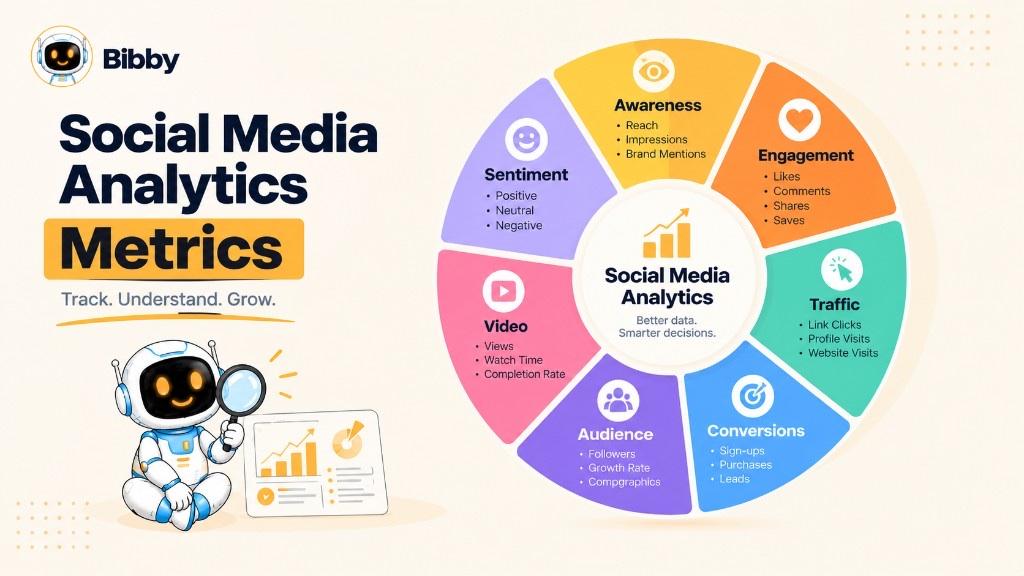
Most measurements fall into reach, engagement, traffic, conversions, audience, video, and sentiment. The useful set depends on the objective.
Reach and Awareness Metrics
- Reach: Unique users who saw content
- Impressions: Times content was displayed
- Views and video views (definitions vary by platform)
- Follower growth
- Brand mentions and share of voice (usually in a listening tool)
Reach shows visibility. It does not prove the content was useful.
Engagement Metrics
Likes, comments, shares, saves, replies, profile interactions, and engagement rate put interactions in context. 500 interactions mean different things on different inventory and audience sizes.
Traffic Metrics
Link clicks, CTR, referral visits, landing-page visits, and bio or link-in-bio clicks show whether people left the feed for another destination.
Conversion Metrics
Leads, sign-ups, purchases, demo requests, subscriptions, revenue, and conversion rate connect social activity to outcomes. Track them in web analytics, CRM, or ads tools—not in Bibby.
Audience Metrics
Age ranges, location, language, interests, activity, and new versus returning audiences (where platforms provide them) show whether you are reaching the people you intended.
Video Analytics
Views, watch time, average duration, retention, completion, and replays matter more than a view count alone. Early drop-off often points to the hook. Strong completion can justify more of that format.
Sentiment Metrics
Sentiment classifies conversations as positive, negative, or neutral. Volume says people talked; sentiment adds tone. Review it in a listening or analytics product.
Which Metrics Matter Most?
| Social Media Goal | Important metrics |
|---|---|
| Brand awareness | Reach, impressions, views, follower growth |
| Engagement | Comments, shares, saves, reactions, engagement rate |
| Website traffic | Clicks, CTR, referral traffic |
| Lead generation | Leads, conversion rate, cost per lead |
| Sales | Purchases, revenue, conversion rate, CAC |
| Video performance | Watch time, retention, completion rate |
| Audience growth | Followers, growth rate, demographics |
| Brand perception | Mentions, sentiment, share of voice |
Connect the right metrics to the right objective. Avoid treating every number as equally important.
What Are the Types of Social Media Analytics?
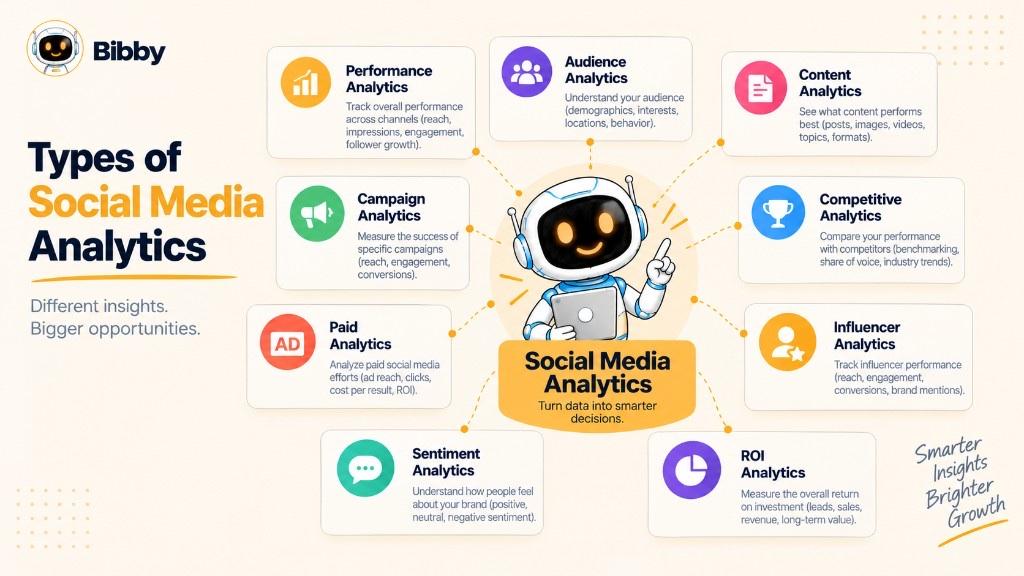
Types are based on what you want to understand.
1. Performance Analytics
Account and content results over time: reach, impressions, engagement, clicks, views, conversions. Questions: Which posts work? Is performance improving? Which formats repeat?
2. Audience Analytics
Who follows and interacts: demographics, location, interests, growth, and behavior. Useful when you need to know whether the right people are in the room.
3. Content Analytics
Compare topic, format, length, visual style, caption, hook, CTA, platform, and time. Educational carousels may earn saves while short-form video earns reach.
4. Campaign Analytics
Measure a launch, offer, or lead campaign against its own goals: reach, engagement, clicks, conversions, and—when you have cost data—ROI.
5. Competitive Analytics
Compare available competitor signals: growth, formats, frequency, topics, mentions, share of voice. Follower count alone is a weak comparison.
6. Paid Social Analytics
Ads metrics such as CPC, CPM, CTR, cost per acquisition, and return on ad spend live in ads managers. Bibby does not run ads or report ROAS.
7. Influencer Analytics
Evaluate creator partnerships on reach, engagement, clicks, and conversions—not follower count alone.
8. Sentiment Analytics
Tone around a brand, product, or campaign. Complements volume; does not replace it.
9. Social Media ROI Analytics
Connect spend and time to leads, sales, and revenue in finance or attribution tools. See also ROI and KPIs.
These types work together:
Audience → Content → Performance → Campaign → Business Outcome
Social Media Analytics vs. Social Media Metrics
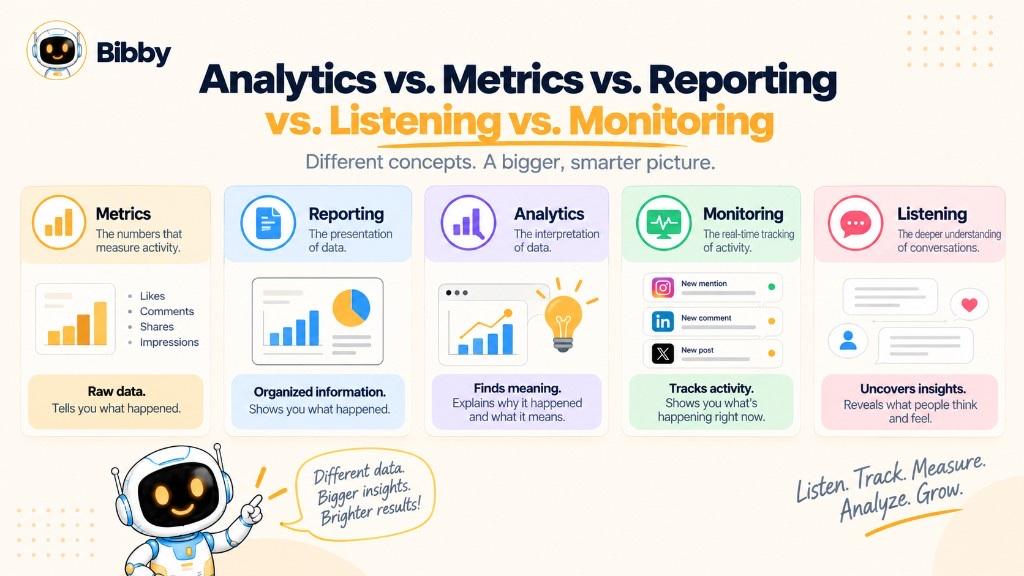
They are related, but not the same.
Metrics are the numbers. Analytics is what you learn from the numbers.
10,000 impressions is a metric. Finding that educational posts consistently earn more impressions than promotional posts—and changing the mix—is analytics.
| Social Media Metrics | Social Media Analytics |
|---|---|
| Individual measurements | Interpretation of multiple data points |
| Shows what happened | Helps explain what happened |
| Likes, reach, clicks | Patterns and trends |
| Raw performance | Actionable insights |
| “How much?” | “Why?” and “What next?” |
Confusing the two often leads to vanity metrics: celebrating followers or views without checking relevance, engagement quality, or conversions.
Metrics → Context → Analysis → Insight → Action
Social Media Analytics vs. Social Media Reporting
Reporting tells you what happened. Analytics helps explain why it happened and what to do next.
A report might say Instagram reach rose 35%. Analytics might add that short educational videos drove most of that lift—so you can test more of them.
| Reporting | Analytics |
|---|---|
| Presents data | Interprets data |
| Summarizes a period | Can span many periods |
| Communicates results | Supports decisions |
They work best together: Collect → Analyze → Report insights → Act → Measure again. A polished chart is not a strategy.
Social Media Analytics vs. Social Listening
Analytics tells you how your social activity performed. Listening tells you what people are saying and feeling.
| Analytics | Social listening |
|---|---|
| Owned social performance | Broader conversations |
| Reach, engagement, clicks | Mentions, topics, sentiment |
| Optimize publishing | Understand opinions and trends |
A product launch can look strong in Insights (impressions, clicks, conversions) while listening shows praise for design, complaints about price, and competitor comparisons. Use both when you need the full picture. Bibby publishes follow-up content; it does not listen or score sentiment.
Social Media Analytics vs. Social Media Monitoring
Monitoring helps you see what is happening now. Analytics helps you understand what the data means over time.
Monitoring tracks mentions, comments, messages, reviews, and keywords so teams can respond. Analytics looks at reach, engagement, trends, and campaign results to inform strategy.
A single complaint needs a response (monitoring). A month-long rise in service-related posts is a pattern (analytics). Many teams need both.
Why Is Social Media Analytics Important?
Analytics replaces assumptions with evidence.
- See what content works — topics, formats, hooks, and CTAs that earn attention or clicks.
- Understand the audience — who engages, where they are, when they are active.
- Improve strategy — refine the content strategy instead of repeating a calendar forever.
- Inform posting decisions — test times against your own history, not a universal formula. Best-time tools are a starting point; Insights confirm it.
- Measure campaigns against the objective you set.
- Support ROI conversations with traffic, leads, and sales from the right systems.
- Spot trends early enough to adjust.
- Benchmark month-over-month, campaign-to-campaign, and format-to-format.
- Allocate resources to channels and formats that actually contribute.
- Create a loop: Create → Publish → Measure → Analyze → Learn → Optimize → Create again.
Posting without feedback is activity. Analytics is the feedback mechanism.
Social Media Analytics Example
A software company publishes educational posts, promotional images, carousels, and short videos across Instagram, LinkedIn, Facebook, TikTok, and YouTube.
| Content type | Reach | Engagement | Website clicks |
|---|---|---|---|
| Educational carousel | 25,000 | 2,100 | 480 |
| Promotional image | 32,000 | 900 | 190 |
| Short-form video | 60,000 | 2,800 | 350 |
| Product announcement | 18,000 | 700 | 210 |
Short video wins reach. The carousel wins clicks. The “best” format depends on the goal. Several months of similar patterns are stronger than one table.
The team might then produce more educational content, use short video for awareness, lean on LinkedIn for qualified leads, and cut weak promotional images. They create and schedule the next batch in Bibby, then review new results in Insights.
A single LinkedIn post with 15,000 impressions and 300 clicks is interesting only when compared with typical posts. Investigate topic, hook, format, caption, visual, CTA, time, and audience—then test those elements. Do not assume one winner copies forever.
Data tells you what happened. Comparison provides context. Analysis identifies patterns. Insights guide action.
Social Media Analytics Across Social Platforms
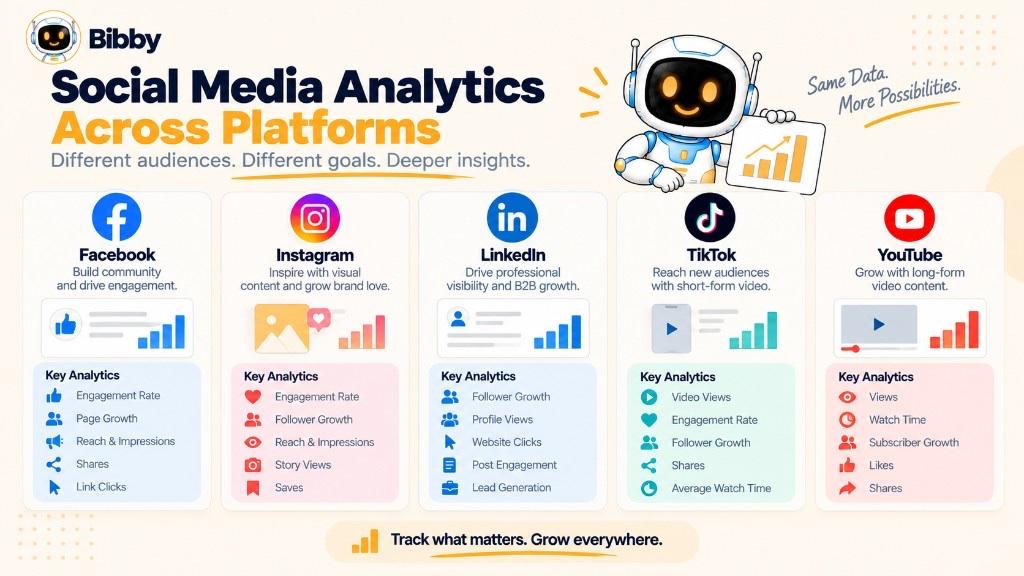
Metrics and user behavior differ by network. Analyze each platform in context, then look at the whole mix.
Reach, impressions, reactions, comments, shares, video views, follower growth, clicks, and audience information in Facebook Insights.
Posts, carousels, Reels, Stories, and live each have their own signals. Reels may expand reach while carousels earn saves. Compare formats against the goal.
Impressions, reactions, comments, shares, clicks, and audience characteristics. Technical posts may earn fewer impressions but better qualified traffic.
TikTok
Views, watch time, retention, and For You discovery matter more than a raw view count.
YouTube
Watch time, retention, impressions, CTR, traffic sources, and subscribers. Two videos with the same views can have very different retention.
| Platform | Potential strength | Useful analytics |
|---|---|---|
| Community and broad reach | Reach, engagement, clicks | |
| Visual discovery | Reach, saves, shares, Reels | |
| Professional audiences | Impressions, clicks, leads | |
| TikTok | Short-form discovery | Views, watch time, retention |
| YouTube | Video depth | Watch time, retention, CTR |
These are tendencies, not rules. A view is not defined the same way everywhere. Ask: How well does this platform serve this objective?
Cross-platform tools can sit beside native Insights. Bibby scheduling covers Facebook, Instagram, LinkedIn, YouTube, and TikTok—not X—and does not merge analytics.
What Is a Social Media Analytics Tool?
A social media analytics tool collects, organizes, and analyzes platform data so teams can see trends without opening every native dashboard. Typical questions: Which posts worked? Which formats repeat? Which platforms contribute traffic or leads? How has performance changed?
Connect accounts → Collect → Organize → Analyze → Act
| Native Insights | Dedicated analytics tool |
|---|---|
| One platform | Often many platforms |
| Deep platform-specific data | Cross-channel comparison |
| Several logins | Unified view |
Neither is automatically better. Native tools are authoritative for that network. Third-party tools help when you manage many accounts. Bibby is a create-and-schedule product, not an analytics suite.
Useful tools make data understandable: content and audience views, engagement, reach, conversions (when tracking exists), campaigns, history, and optional benchmarks. The value is insight, not more charts.
What Features Should a Social Media Analytics Tool Have?
Look for capabilities that match your operation:
- Multi-platform connections
- Content-level comparison
- Audience insights where available
- Engagement and rate calculations
- Campaign grouping
- Historical baselines
- Cross-platform comparison by objective
- Custom reports for managers versus executives
- Automated reporting for agencies
- Careful competitor benchmarks
- Conversion and ROI tracking in the right systems
- Optional AI summaries—still verify in context
- Recommendations treated as hypotheses
- Natural-language queries in some products
A small business may need a clear dashboard and post-level stats. An agency may need client reports and multi-account views. The longest feature list is not automatically the right tool. Bibby does not provide these dashboards.
Choosing the Right Social Media Analytics Features
Pick the data you will actually use. Then keep the loop:
Collect → Understand → Decide → Act → Measure again
Analytics should feed the next publish cycle, not sit in a slide deck.
How to Use Social Media Analytics to Improve Your Social Media Strategy
Publish → Measure → Analyze → Learn → Adjust → Publish again
- Start with a goal — awareness, engagement, traffic, leads, sales, or community.
- Match KPIs to that goal.
- Set a baseline from recent history.
- Find repeating winners by topic, format, caption, hook, CTA, time, and platform.
- Study weak posts without overreacting to one miss.
- Compare formats using your data, not generic rules.
- Compare platforms by role, not raw follower count.
- Treat timing as a test, not a permanent rule.
- Turn patterns into experiments — more educational carousels, new hooks, clearer CTAs.
- Change one meaningful variable at a time when you can.
- Connect insight to a workflow — create, caption, and schedule in Bibby; measure in Insights.
- Review weekly, monthly, and quarterly at a depth that matches how often you publish.
The Social Media Analytics Improvement Loop
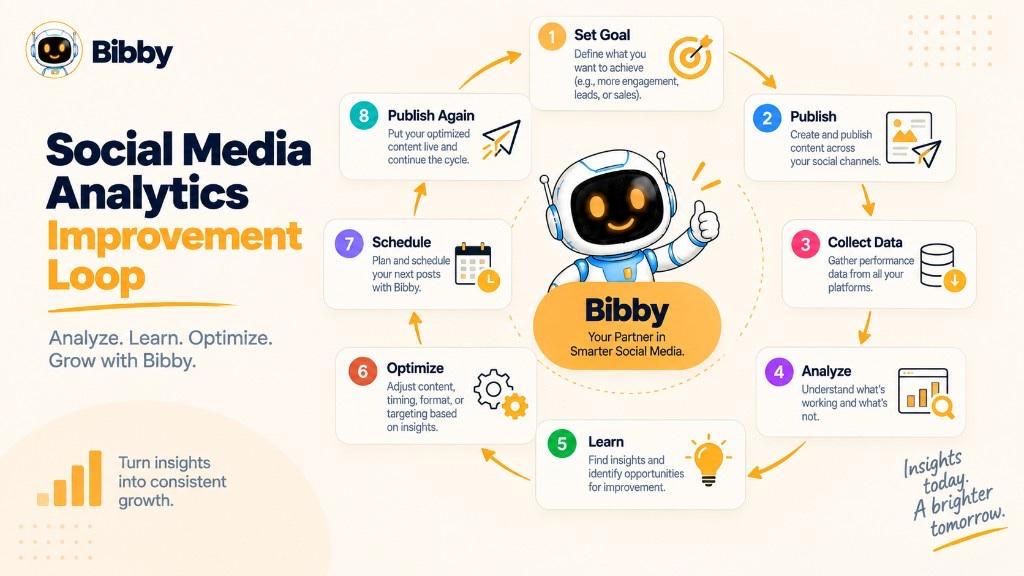
Set goals → Choose metrics → Publish → Collect → Analyze → Identify patterns → Adjust → Publish → Measure again
The goal is not a perfect post every time. It is continuous learning about content, audiences, platforms, and objectives.
How Is AI Changing Social Media Analytics?
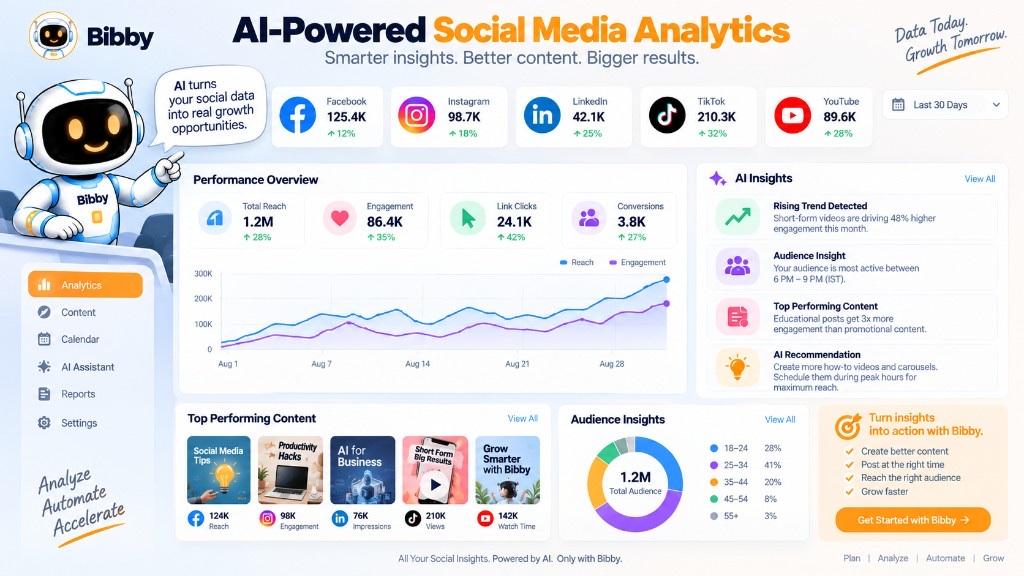
AI in analytics products can summarize reports, flag unusual changes, cluster top posts, and suggest tests. Predictions are estimates, not guarantees. Conversational analytics (“Which posts drove clicks last month?”) lives in those products.
AI in Bibby can generate ideas, images, and captions, and help schedule on supported channels. Using AI to write a caption does not make a post more likely to rank, and it does not analyze your Insights.
AI does not replace judgment. A spike can be a campaign, a trend, controversy, paid spend, or a platform change. Treat recommendations as experiments.
Traditional path: Data → Dashboard → Human analysis → Decision.
AI-assisted path: Data → Suggested insight → Human decision → Action.
The purpose stays the same: turn data into useful decisions.
How Social Media Analytics Works With Social Media Automation
Analytics without action leaves insights unused. Automation without analytics publishes on repeat without knowing if the mix works.
Create → Publish → Measure → Analyze → Optimize → Schedule → Publish again
| Insight | Possible action |
|---|---|
| Instagram carousels earn more saves | Create more educational carousels |
| TikTok videos earn more reach | Test more short-form video |
| LinkedIn drives qualified traffic | Prioritize professional posts |
| Promotional posts underperform | Test problem-solving content |
Automation should not mean “publish more.” It means less repetitive execution after strategy is set. Bibby can upload or generate visuals, apply a posting style, generate captions, build campaigns and a brand kit in chat, and schedule images, carousels, videos, and Stories on Facebook, Instagram, LinkedIn, YouTube, and TikTok. Performance review stays in Insights.
Analytics = learn. Strategy = decide. Automation = execute. New data = learn again.
Social Media Analytics With Bibby
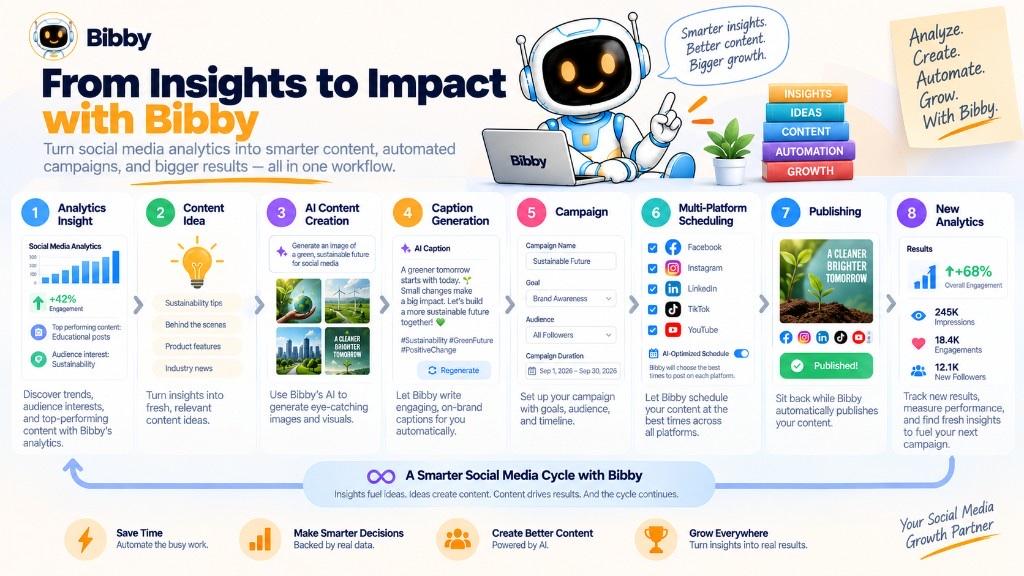
Bibby sits on the action side of the loop:
Analyze (Insights or an analytics tool) → Learn → Create → Schedule → Publish → Analyze again
If analytics shows educational carousels work, create a new series: generate or upload visuals, pick a style, generate captions, and schedule on supported channels. Start a trial or try free tools for ideas and captions. Compare plans if you need a regular calendar.
Analytics should guide tests, not freeze the brand into copying one post. Patterns are hypotheses. Measure whether they continue.
How to Start Using Social Media Analytics
Set goals → Choose metrics → Collect data → Baseline → Analyze → Act → Measure again
- Define the outcome you want.
- Choose a short KPI list.
- Open native Insights (and a dedicated tool if you need one).
- Establish a baseline.
- Compare content by topic, format, and CTA.
- Check whether the audience matches the business.
- Give each platform a role.
- Look for repeatable winners.
- Investigate weak areas without panic.
- Design one experiment at a time.
- Automate the publishing chores, not the thinking.
- Repeat on a weekly, monthly, and quarterly rhythm.
A Simple Social Media Analytics Routine
Weekly: Scan recent posts for outliers.
Monthly: Compare formats, platforms, audience, and campaigns.
Quarterly: Review outcomes and strategy.
Consistency matters more than a perfect template.
Common Social Media Analytics Mistakes
- Chasing vanity metrics — followers and views without relevance or outcomes.
- Tracking everything — more charts, less clarity.
- Ignoring the objective — a funny viral post may not be a lead asset.
- Treating every platform as identical — definitions and behavior differ.
- Deciding from one post — wait for patterns.
- Skipping historical context — 10,000 impressions may be normal for you.
- Confusing correlation with cause — test before rewriting the strategy.
- Ignoring weak content — misses teach as much as hits.
- Reading engagement without tone or quality — controversy is not success.
- Stopping before conversions when the goal is demand.
- Reporting numbers with no explanation.
- Ignoring audience segments.
- Treating analytics as an annual chore.
- Automating a weak mix — schedule after you know what to repeat.
- Trusting AI summaries blindly.
Start with the goal. Choose relevant metrics. Use context. Look for patterns. Connect insight to a decision. Review regularly.
The point is not an impressive dashboard. It is accurate understanding and better next posts. Browse the marketing dictionary, read the blog, or complete onboarding when you are ready to schedule the next experiment—without treating the calendar as an analytics product.