
Engagement rate is a social media metric that shows how actively people interact with your content compared with the size of the audience that saw it or could have seen it. These interactions can include likes, comments, shares, saves, clicks, reactions, replies, and other actions, depending on the social media platform.
Simply put, engagement rate helps answer an important question: Is your content actually getting people to respond?
For example, a post that reaches 10,000 people and receives 500 interactions has generated a different level of audience response than a post with 500 interactions that reaches 2,000 people. Looking at engagement rate instead of engagement numbers alone gives you more context about how well your content resonates with its audience.
Engagement rate is widely used to evaluate social media content, compare different posts, understand audience preferences, and identify which content formats or topics generate stronger interactions. It can also help marketers make better decisions about their content strategy, posting frequency, creative formats, and publishing times.
However, there is no single engagement rate formula that works perfectly for every situation. Depending on the platform and the goal of the analysis, engagement rate may be calculated using reach, impressions, followers, views, or another audience measurement.
Understanding which formula to use, what counts as an engagement, and how to interpret the result is essential for turning engagement data into useful social media insights.
What Does Engagement Rate Measure?
Engagement rate measures how actively an audience interacts with social media content. Instead of simply counting the number of likes, comments, shares, or other interactions, it puts those actions into context by comparing them with a defined audience or exposure metric.
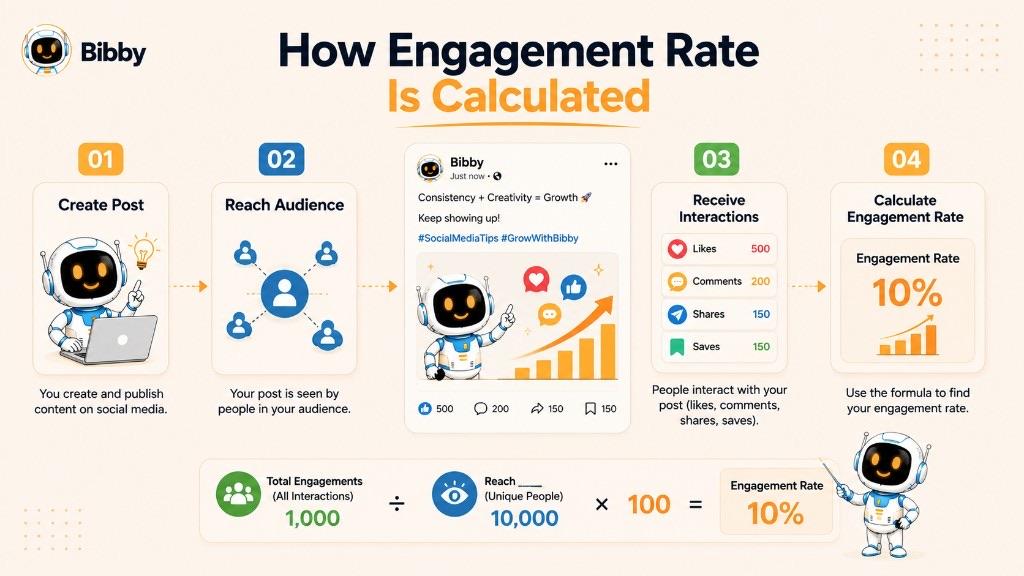
For example, 100 engagements may sound impressive, but the meaning changes depending on whether the post reached 500 people or 50,000 people. Engagement rate helps make that comparison easier.
Depending on the platform and calculation method, engagement rate can help measure:
- Audience interaction: How many people actively respond to a post or piece of content.
- Content resonance: Whether your content is interesting, useful, entertaining, or relevant enough to encourage a response.
- Content performance: Which posts, topics, formats, or campaigns generate stronger audience reactions.
- Audience interest: Whether your followers or viewers are actively participating rather than simply consuming content passively.
- Social media effectiveness: How well your content encourages actions that matter to your social media strategy.
A higher engagement rate generally indicates that a larger proportion of the measured audience is interacting with the content. However, engagement rate should not be viewed in isolation. A post can have excellent engagement but generate few website visits, leads, or sales, depending on the campaign objective.
That is why engagement rate works best alongside other social media metrics such as reach, impressions, clicks, follower growth, conversions, and video views. Together, these metrics provide a clearer picture of how your social media content is performing.
How to Calculate Engagement Rate
The basic engagement rate formula is:
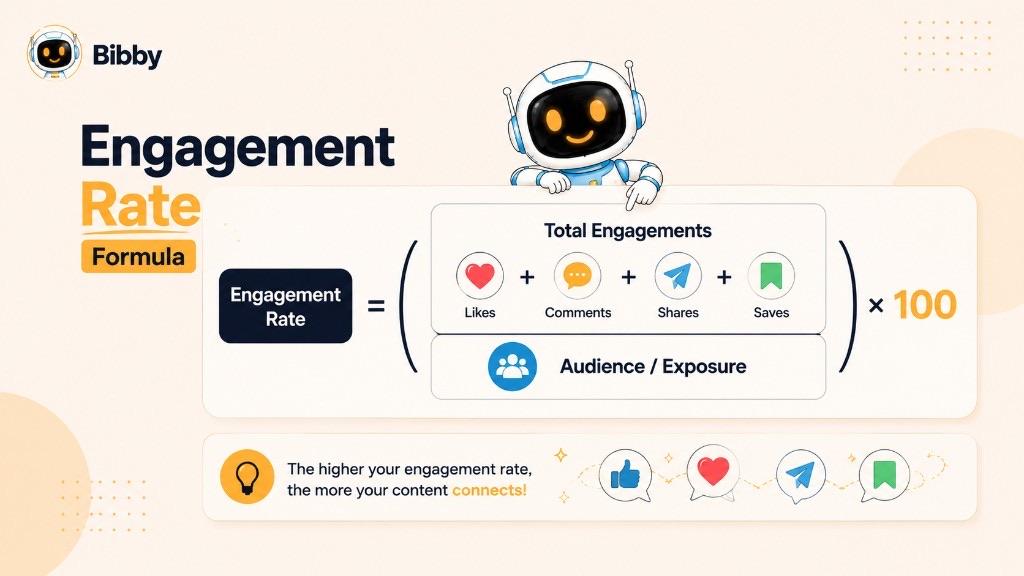
The important part is understanding what you use as the audience or exposure in the calculation. Depending on the platform, reporting method, and purpose of your analysis, you may calculate engagement rate based on reach, followers, impressions, views, or another measurement.
For example, if a post receives 300 total engagements and reaches 6,000 people:
Engagement Rate = (300 ÷ 6,000) × 100 = 5%
This means 5% of the people reached by the post interacted with it—or, more precisely, that total reported interactions equal 5% of reach.
What Counts as Total Engagements?
Total engagements can include different types of interactions, such as:
- Likes and reactions
- Comments
- Shares
- Saves
- Clicks
- Replies
- Mentions
- Other platform-specific interactions
The exact engagement actions included in the calculation can vary between social media platforms.
Why Does the Formula Matter?
Two posts can receive exactly the same number of interactions but have very different engagement rates.
For example:
- Post A: 500 engagements from 10,000 people reached = 5%
- Post B: 500 engagements from 2,500 people reached = 20%
Both posts generated 500 engagements, but Post B produced substantially more interaction relative to its reach.
This is why engagement rate provides more context than looking at raw engagement numbers alone. It helps you understand how strongly your content performed relative to the audience or exposure it received.
Engagement Rate by Reach
Engagement rate by reach measures how many of the people who actually saw your content interacted with it. Because reach represents the number of unique users or accounts exposed to your content, this method can provide a useful view of how effectively a post engaged the audience it reached.
For example, suppose an Instagram post reaches 8,000 accounts and receives:
- 400 likes
- 80 comments
- 120 shares
- 200 saves
That gives the post 800 total engagements.
Engagement Rate = (800 ÷ 8,000) × 100 = 10%
The post therefore has a 10% engagement rate by reach.
Why Use Reach to Calculate Engagement Rate?
Reach-based engagement rate is particularly useful when evaluating individual posts because it considers the number of people who were actually exposed to the content.
It can help you:
- Compare the performance of different posts
- Identify content that resonates strongly with viewers
- Evaluate different content formats
- Understand audience response beyond raw engagement numbers
- Track changes in content performance over time
For example, if one post reaches 20,000 people and generates 400 engagements while another reaches 5,000 people and generates 300 engagements, looking only at total engagements could make the first post appear more successful. However, their engagement rates by reach would be 2% and 6%, respectively. The second post generated stronger interaction relative to the audience it reached.
Reach-based engagement rate is therefore a useful metric for understanding how effectively your content turns exposure into interaction. However, marketers should still consider other metrics, such as impressions, clicks, conversions, and follower growth, to understand overall content performance.
Engagement Rate by Followers
Engagement rate by followers compares the total interactions on a social media post or account with the number of followers. It is commonly used to understand how much engagement content generates relative to the size of an account's audience.
For example, if an account has 20,000 followers and a post receives 800 engagements:
Engagement Rate = (800 ÷ 20,000) × 100 = 4%
The engagement rate by followers is therefore 4%.
Why Use Followers in the Calculation?
Follower-based engagement rate can be useful when comparing accounts or tracking how engagement changes as an audience grows. It provides a simple way to put engagement numbers into the context of an account's overall follower base.
However, there is an important limitation: not every follower sees every post.
An account may have 20,000 followers, but a particular post might reach only a fraction of them. This means follower-based engagement rate does not necessarily show how people who actually saw the content responded.
For this reason, follower-based engagement rate can be useful for account-level comparisons, while reach-based engagement rate may provide more context when analyzing the performance of individual posts.
When comparing engagement rates between accounts, make sure the same formula and engagement definition are being used. Otherwise, the numbers may look comparable when they are actually measuring different things.
Engagement Rate by Impressions
Engagement rate by impressions measures how many interactions your content generates compared with the total number of times it was displayed. Unlike reach, which generally counts unique accounts or users, impressions can include multiple views from the same person.
For example, suppose a social media post receives 25,000 impressions and generates 750 engagements.
Engagement Rate = (750 ÷ 25,000) × 100 = 3%
The post has an engagement rate by impressions of 3%.
Why Use Impressions?
Impression-based engagement rate can be useful when you want to understand how effectively content generates interaction relative to the number of times it was displayed.
It can help you:
- Evaluate content performance across campaigns
- Understand interaction relative to repeated exposure
- Compare content with different impression volumes
- Analyze the effectiveness of content distribution
- Identify posts that generate strong interaction despite receiving fewer impressions
Reach vs. Impressions
The key difference is that reach measures unique exposure, while impressions measure total exposure.
For example, if 1,000 people each see a post twice:
- Reach: 1,000
- Impressions: 2,000
The same audience has generated twice as many impressions because the content was displayed multiple times.
This distinction matters when interpreting engagement rate. A post can have a different engagement rate by impressions than by reach because the two formulas use different denominators.
Impression-based engagement rate is therefore most useful when you specifically want to understand how much interaction content generates relative to its total number of displays.
Engagement Rate by Views
Engagement rate by views measures how many interactions a piece of content receives compared with the number of times it was viewed. This approach is particularly useful for video content, where views are often a more relevant measure of exposure than followers or impressions.
For example, if a video receives 50,000 views and generates 2,500 engagements:
Engagement Rate = (2,500 ÷ 50,000) × 100 = 5%
The video's engagement rate by views is therefore 5%.
Why Use Views to Calculate Engagement Rate?
View-based engagement rate can help you understand how effectively video content turns views into interactions. It can be particularly useful when analyzing:
- Short-form videos
- Reels
- TikTok videos
- YouTube videos
- Other video-based social content
For example, two videos might receive the same number of views but generate very different levels of engagement. The video with more comments, shares, likes, saves, or other relevant interactions will generally have the higher engagement rate.
Views vs. Impressions
Views and impressions are not always interchangeable. An impression generally represents an instance where content was displayed, while a view usually indicates that video content was viewed according to the platform's definition.
Because platforms can define views differently, it is important to understand how the specific platform counts a view before comparing engagement rates.
View-based engagement rate is most useful when the primary goal is to evaluate how audiences interact with video content after viewing it, rather than simply measuring how many people follow an account or how many times content was displayed.
What Counts as an Engagement?
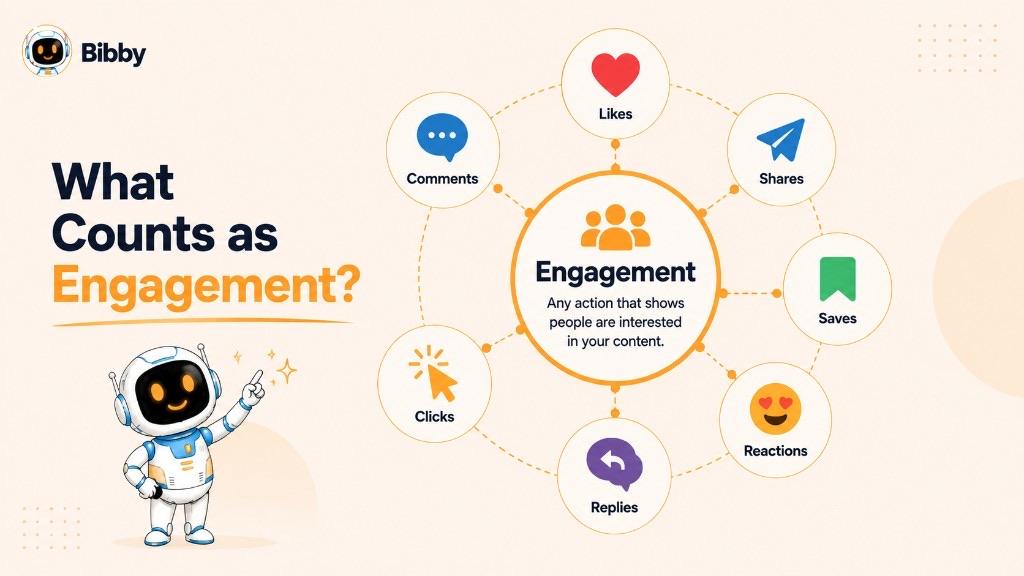
An engagement is an action someone takes in response to your social media content. These actions show that users are doing more than simply scrolling past or viewing a post.
The exact actions included in an engagement rate can vary by platform and by the analytics tool being used. Common examples include:
- Likes and reactions: Quick signals that someone responded positively or emotionally to your content.
- Comments: Direct responses that can indicate deeper interest or conversation.
- Shares: When users distribute your content to their own audience or connections.
- Saves: When users bookmark content to return to later, often indicating that they find it useful or valuable.
- Clicks: Actions such as clicking a link, profile, button, or other interactive element. Click-through rate then measures how often those clicks happen relative to exposure.
- Replies: Responses to content, particularly relevant for stories, posts, and conversations.
- Mentions: When users reference your account or brand in their own content.
- Video interactions: Platform-specific actions taken while engaging with video content.
Are All Engagements Equally Valuable?
Not necessarily.
A like requires very little effort, while writing a thoughtful comment, sharing a post with others, or saving useful content can represent a stronger level of interest. The value of each interaction also depends on your social media objective.
For example, a brand focused on awareness may place more value on shares and reach, while a brand promoting educational content may pay close attention to saves and comments.
This is why looking only at the total number of engagements can sometimes hide useful information. A more detailed analysis examines which types of interactions are happening and what they indicate about audience behavior.
Engagement Definitions Can Differ by Platform
Facebook, Instagram, LinkedIn, YouTube, and TikTok do not necessarily use identical engagement metrics or definitions. Some platforms provide specialized interactions and analytics that are specific to their content formats.
When calculating or comparing engagement rates, use a consistent definition of engagement and check the platform's own analytics terminology. This helps prevent misleading comparisons and gives you a more accurate understanding of how your content is performing.
Why Is Engagement Rate Important?
Engagement rate is important because it helps you understand how strongly your content connects with the audience that sees it. Follower counts and reach can tell you how large your potential or actual audience is, but engagement rate adds another layer by showing whether people are taking action.
For businesses and creators, this makes engagement rate a useful metric for evaluating content quality and making better social media decisions.
It Shows Whether Content Resonates
A post can reach thousands of people without generating much interaction. A strong engagement rate can indicate that the content is relevant, useful, entertaining, or interesting enough to encourage people to respond.
For example, an educational carousel that receives a large number of saves and shares may indicate that the audience considers the information valuable.
It Helps Compare Content Performance
Engagement rate makes it easier to compare different posts, even when they receive different amounts of reach or exposure.
You can compare:
- Different topics
- Images and carousels
- Videos and stories
- Educational and promotional content
- Different campaigns
- Different posting styles
Instead of asking only "Which post received the most likes?", you can ask "Which post generated the strongest audience response relative to its exposure?"
It Reveals Audience Preferences
Patterns in engagement can help you discover what your audience wants to see.
For example, suppose a brand notices that its how-to posts consistently generate more saves and shares than product announcements. That pattern could suggest that the audience finds educational content more valuable.
These insights can then influence future content planning.
It Provides More Context Than Follower Count
Having thousands of followers does not necessarily mean an account has an active audience.
An account with 50,000 followers may receive less interaction than another account with 5,000 highly relevant followers. Engagement rate helps put audience interaction into context rather than relying on follower count alone.
It Can Guide Your Social Media Strategy
Tracking engagement rate over time can help you identify which content approaches are working and where there is room for improvement.
You can use the data to test:
- Different content formats
- New topics and themes
- Caption styles
- Calls to action
- Posting frequencies
- Publishing times
- Campaign concepts
The goal is not simply to chase a higher percentage. Instead, engagement rate should help you understand what your audience responds to and why, so you can create a more effective and consistent social media strategy.
Engagement Rate vs. Reach vs. Impressions
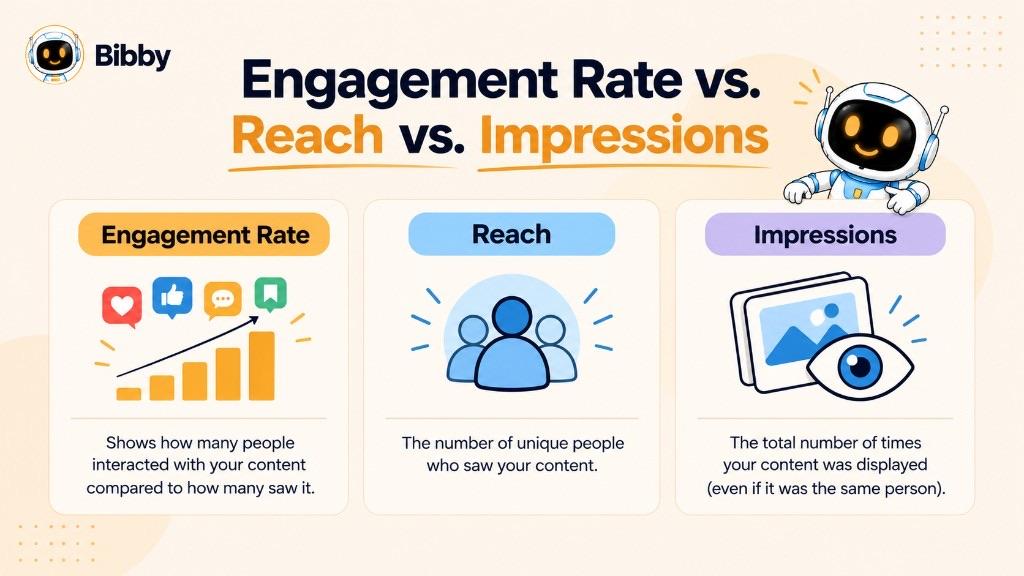
Engagement rate, reach, and impressions are closely related social media metrics, but they measure different aspects of content performance. Understanding the difference helps you interpret your analytics without confusing audience size with audience interaction.
| Metric | What It Measures | Main Question |
|---|---|---|
| Engagement Rate | Interactions relative to an audience or exposure metric | How actively are people interacting? |
| Reach | Number of unique accounts or users exposed to content | How many people saw the content? |
| Impressions | Total number of times content was displayed | How many times was the content displayed? |
Engagement Rate
Engagement rate puts audience interactions into context. Depending on the formula, it can be calculated using reach, impressions, followers, views, or another relevant metric.
It helps answer:
"How much interaction did this content generate relative to its audience or exposure?"
Reach
Reach generally represents the number of unique accounts or users who were exposed to your content.
For example, if 5,000 different people see a post, the post may have a reach of 5,000.
Reach is useful for understanding the size of the audience your content actually reached.
Impressions
Impressions represent the total number of times content was displayed. The same person can contribute multiple impressions if they see the content more than once.
For example, if 5,000 people each see a post twice:
- Reach: 5,000
- Impressions: 10,000
Why the Difference Matters
Imagine two posts:
Post A
- Reach: 10,000
- Engagements: 500
- Engagement rate by reach: 5%
Post B
- Reach: 2,000
- Engagements: 300
- Engagement rate by reach: 15%
Post A generated more total engagements, but Post B generated a much higher level of interaction relative to its reach.
This illustrates why social media performance should not be judged using a single number. Reach tells you how many unique people you reached, impressions tell you how often content was displayed, and engagement rate helps you understand the interaction generated from that exposure.
Engagement Rate vs. Engagement
Engagement and engagement rate are related, but they are not the same metric.
Engagement refers to the actual interactions your content receives, such as likes, comments, shares, saves, clicks, and other platform-specific actions.
Engagement rate puts those interactions into context by comparing them with a defined audience or exposure measurement.
For example, imagine a post receives:
- 400 likes
- 50 comments
- 30 shares
- 20 saves
The post has 500 total engagements if all four interaction types are included in the calculation.
If the post reached 5,000 people, its engagement rate by reach would be:
(500 ÷ 5,000) × 100 = 10%
So, 500 is the engagement, while 10% is the engagement rate.
Why the Difference Matters
Looking only at total engagement can sometimes give you an incomplete picture.
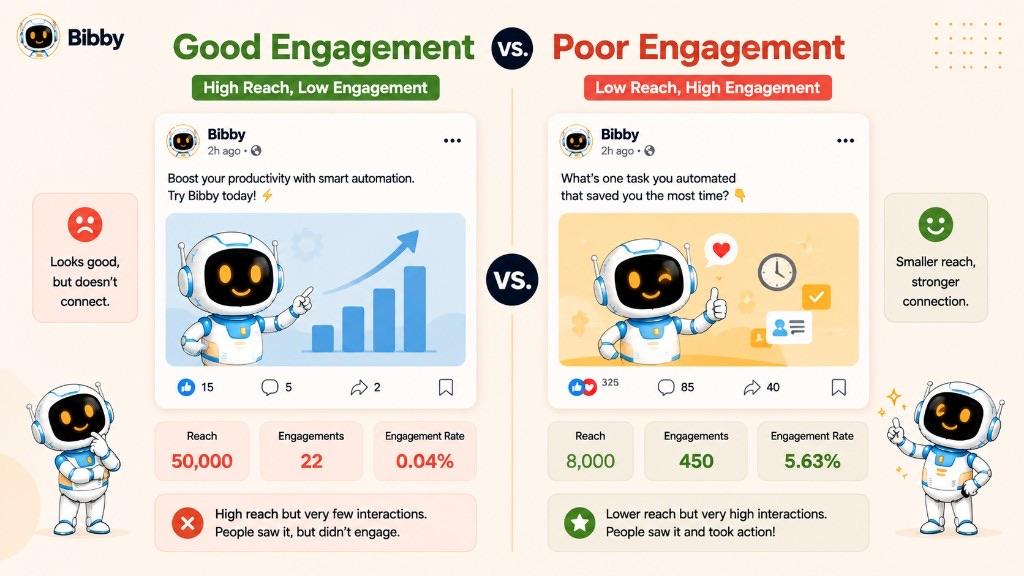
Suppose one post receives 1,000 engagements and another receives 500. It might seem obvious that the first post performed better. But if the first post reached 100,000 people while the second reached only 2,500 people, the engagement rates tell a very different story.
- Post A: 1,000 ÷ 100,000 = 1%
- Post B: 500 ÷ 2,500 = 20%
Post A generated more interactions overall, but Post B generated much stronger interaction relative to its reach.
This is why marketers often look at both metrics together. Engagement tells you how many interactions occurred, while engagement rate helps explain how significant those interactions were relative to the audience or exposure.
What Is a Good Engagement Rate?
There is no single engagement rate that can be considered "good" for every social media account, platform, industry, or content format. A rate that looks strong for one account may be average for another.
The right benchmark depends on several factors, including how engagement rate is calculated, the social media platform, audience size, content format, industry, and whether the content is organic or paid.
Why There Is No Universal Good Engagement Rate
Different platforms measure engagement differently, and marketers may use different formulas to calculate the rate. A rate based on reach cannot always be compared directly with one based on followers or impressions.
Content format also matters. A short-form video, Instagram carousel, LinkedIn text post, and story can have very different engagement patterns.
Audience size can matter as well. Smaller, highly targeted accounts may sometimes generate stronger engagement rates than large accounts with broader audiences.
How Should You Judge Your Engagement Rate?
Instead of focusing on a universal percentage, start by comparing your current performance with your own historical data.
Look for patterns such as:
- Is your average engagement rate increasing?
- Which posts consistently perform above average?
- Which content formats generate the most interaction?
- Which topics receive more comments, shares, or saves?
- Does engagement change when you publish at different times?
- Are particular campaigns producing stronger audience responses?
You can then compare your results with relevant industry and competitor benchmarks to add additional context.
A Higher Engagement Rate Isn't Always Better
A high engagement rate is generally a positive signal, but it does not automatically mean a campaign was successful.
For example, a post could generate excellent engagement but produce very few:
- Website visits
- Leads
- Sign-ups
- Purchases
- Other desired actions
If the objective of a campaign is to generate sales, engagement rate should be evaluated alongside conversion-related metrics.
The most useful approach is to treat engagement rate as one part of your social media performance picture, rather than a number to maximize at all costs. The goal is to generate meaningful engagement from the right audience while moving toward the broader objective of your social media strategy.
What Can Affect Engagement Rate?
Engagement rate is influenced by much more than the number of followers an account has. The content you publish, how relevant it is to your audience, when you publish it, and how people discover it can all affect the level of interaction your posts receive.
Understanding these factors can help you identify why some content performs better than others.
Content Quality
Useful, entertaining, educational, original, or visually appealing content is more likely to encourage people to stop scrolling and interact.
Poorly presented or repetitive content can have the opposite effect, even when it reaches a large audience.
Audience Relevance
Content needs to match the interests, needs, and expectations of the people you're trying to reach.
A post can receive thousands of impressions but generate little engagement if it is shown to people who have little interest in the topic.
Content Format
Different formats encourage different types of interactions.
For example:
- Carousels may generate saves and shares.
- Videos may encourage comments, shares, and other video interactions.
- Stories can generate replies and other quick interactions.
- Images may generate likes, comments, or shares.
Testing multiple formats can help you discover what your particular audience responds to.
Posting Time
When you publish can influence how quickly and widely your content reaches your audience.
Posting when your audience is active may give your content a better opportunity to receive early interactions. However, there is no universally perfect posting time, so analyzing your own audience data is more useful than relying entirely on generic recommendations. Tools that identify the best time to post can help you test windows that match your audience.
Posting Frequency
Publishing too rarely can make it difficult to maintain an active relationship with your audience. Posting too frequently without maintaining quality can overwhelm followers and reduce interest.
A consistent publishing schedule can help you maintain a predictable presence while giving you enough opportunities to test different types of content.
Captions and Calls to Action
A strong visual may capture attention, but the caption can encourage people to take the next step.
Clear questions, useful context, conversation starters, and relevant calls to action can encourage meaningful responses. The goal should be to make interaction natural rather than asking for engagement without providing a reason.
Social Media Algorithms
Platform algorithms influence which content is shown to users and how widely it is distributed. Factors such as user behavior, content relevance, and previous interactions can affect visibility.
More exposure can create more opportunities for engagement, while limited distribution can make it harder for content to generate interactions.
Audience Size and Composition
The size of an audience does not tell you how engaged that audience is.
Two accounts with similar follower counts can have very different engagement rates because their audiences may differ in interests, activity levels, relevance, and expectations.
Industry and Niche
Engagement patterns vary across industries. A consumer brand, software company, creator, nonprofit organization, and professional services business may all have different typical interaction patterns.
This is another reason why comparing your engagement rate with a relevant benchmark is more useful than comparing it with an unrelated account.
Seasonality and Current Events
Audience behavior can change depending on holidays, seasons, industry events, breaking news, trends, and other external factors.
A post that performs exceptionally well during one period may not produce the same engagement at another time.
For this reason, engagement rate is best analyzed over time rather than judged from a single post or isolated campaign.
How to Improve Your Engagement Rate
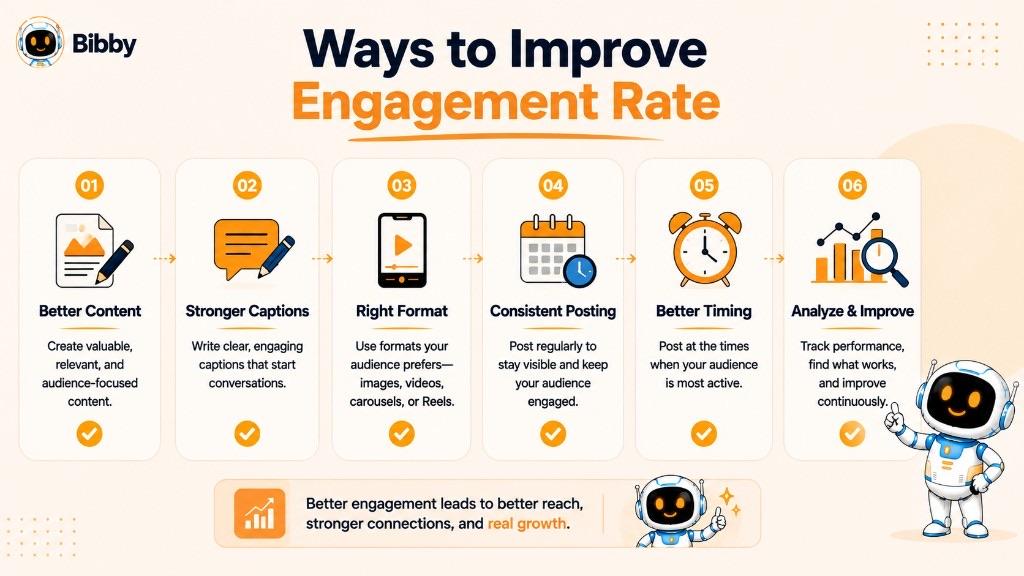
Improving engagement rate is less about chasing likes and more about consistently creating content that gives the right audience a reason to stop, read, watch, respond, save, or share. The best approach is to test different content strategies, measure the results, and repeat what works.
Create Content Your Audience Actually Wants
Start with your audience rather than the platform.
Identify the questions they ask, problems they face, topics they care about, and information they find useful. Content that solves a real problem or provides genuine value has a stronger chance of generating meaningful interactions.
Experiment With Different Content Formats
Don't rely on a single content format. Test different ways of presenting your ideas, including:
- Images
- Carousels
- Videos
- Stories
- Educational posts
- How-to content
- Industry insights
- Behind-the-scenes content
- User-generated content
Track which formats consistently generate stronger engagement from your audience.
Write More Compelling Captions
A caption should add context rather than simply repeat what is already visible in the creative.
Strong captions can include:
- A clear opening hook
- Useful information
- A relatable observation
- A question
- A practical takeaway
- A relevant call to action
The goal is to make it easy for someone to understand why they should keep reading or join the conversation.
Publish Consistently
Consistency gives you more opportunities to reach your audience and learn what works.
A consistent publishing schedule also makes it easier to identify patterns in your analytics because you have enough content to compare across different topics, formats, and publishing times.
Test Different Posting Times
The time you publish can affect how quickly your audience discovers and interacts with your content.
Rather than assuming one universal “best time to post,” test different publishing windows and compare the engagement generated by similar types of content.
Over time, your own performance data can reveal when your audience is most responsive.
Encourage Meaningful Conversations
Give people a genuine reason to participate.
Instead of relying on generic requests for likes or comments, try creating content that invites people to:
- Share an experience
- Answer a relevant question
- Give an opinion
- Discuss a problem
- Share the content with someone who would find it useful
- Save the post for later
Meaningful interactions are generally more useful than engagement generated simply for the sake of increasing a number.
Analyze Your Best-Performing Content
Your existing content can provide some of the best clues about what your audience wants.
Look for patterns among posts with higher engagement rates. Compare:
- Topics
- Hooks
- Formats
- Visual styles
- Caption structures
- Posting times
- Calls to action
Once you identify a pattern, create new variations rather than simply copying the original post.
Use Social Media Automation to Stay Consistent
Maintaining a regular publishing schedule manually across multiple platforms can become time-consuming. Social media automation can help streamline content creation, caption generation, scheduling, and publishing.
With Bibby, you can upload an image or generate one with AI, choose a posting style, and let the platform generate captions and schedule content across selected social media platforms. You can also create images, carousels, videos, and stories, while using Bibby's chat interface to manage tasks such as creating campaigns, building a brand kit, creating posts, and regenerating captions.
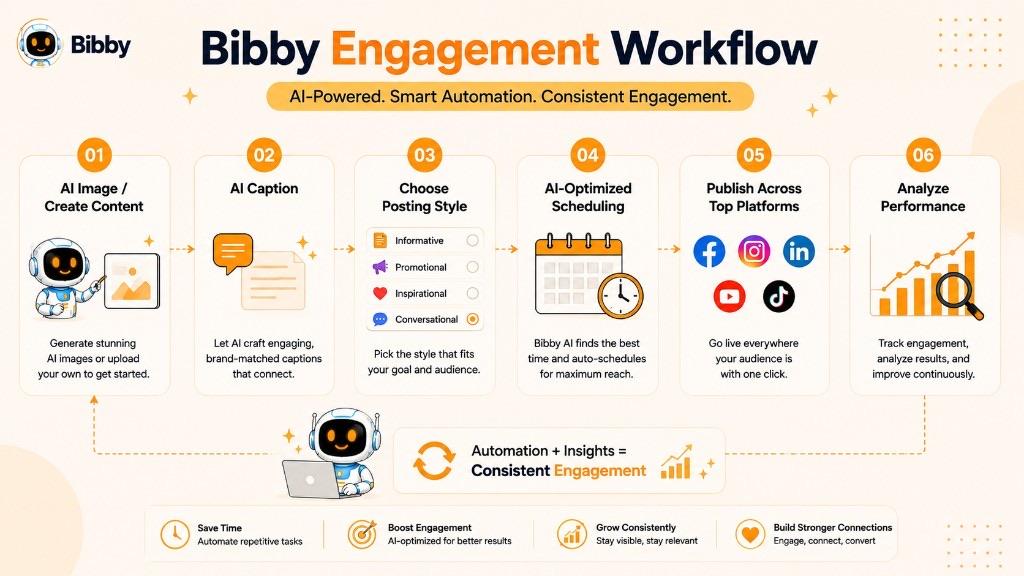
Automation does not guarantee a higher engagement rate, but it can make it easier to publish consistently, test more content, and spend more time analyzing what your audience responds to.
Engagement Rate Example
A simple example can make engagement rate much easier to understand.
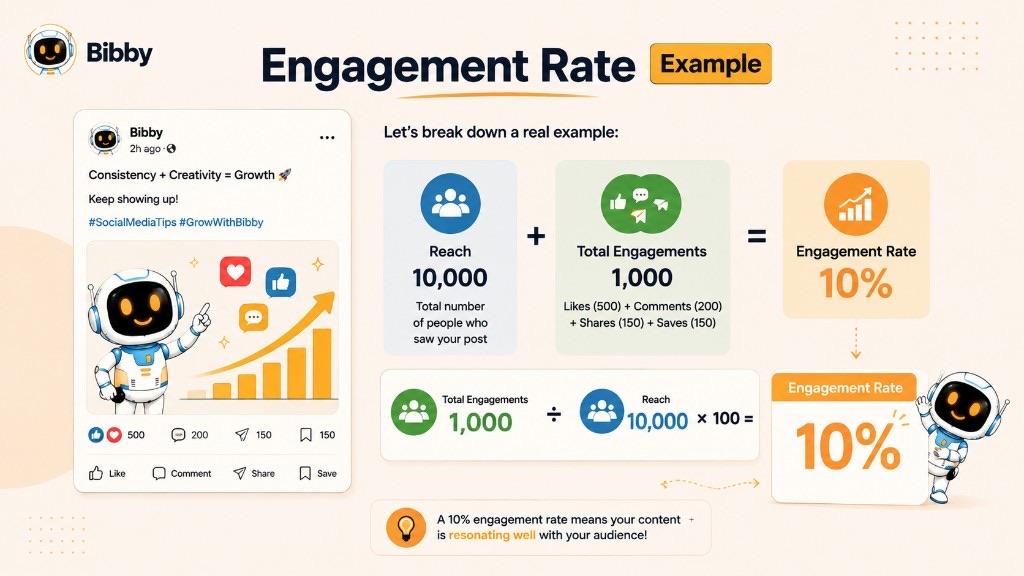
Imagine a brand publishes an Instagram carousel that reaches 10,000 accounts. The post receives:
- 500 likes
- 100 comments
- 150 shares
- 250 saves
The post generates 1,000 total engagements.
Using the engagement rate by reach formula:
Engagement Rate = (Total Engagements ÷ Reach) × 100
So:
(1,000 ÷ 10,000) × 100 = 10%
The post has an engagement rate of 10% by reach.
What Does the 10% Mean?
The 10% figure means that the post generated interactions equal to 10% of its reach, based on the engagement actions included in this calculation.
It does not mean that exactly 10% of people who saw the post interacted with it once. One person can perform multiple actions, such as liking, saving, and sharing the same post. This is why engagement rate should be understood as a measure of interaction relative to reach rather than a precise percentage of unique people who engaged.
A Second Example
Consider another post from the same account:
- Reach: 5,000
- Total engagements: 750
Its engagement rate would be:
(750 ÷ 5,000) × 100 = 15%
The second post generated fewer total engagements than the first, but its engagement rate was higher.
This suggests that the second post generated more interaction relative to the audience it reached.
What Should You Look at Beyond Engagement Rate?
A high engagement rate can indicate that content resonates with an audience, but it does not tell the entire story.
For a more complete performance analysis, also consider:
- Reach
- Impressions
- Clicks
- Profile visits
- Follower growth
- Website traffic
- Leads
- Conversions
- Revenue
For example, a post might generate thousands of likes and comments but produce no website traffic or sales. Another post may receive fewer interactions but generate several qualified leads.
The right interpretation therefore depends on what the content was designed to achieve. Engagement rate is valuable for understanding audience interaction, but it works best when combined with metrics connected to your broader social media goals.
Common Mistakes When Measuring Engagement Rate
Engagement rate can be a useful social media metric, but it is easy to misinterpret. Using the wrong formula, comparing unrelated data, or focusing on a single percentage can lead to inaccurate conclusions about content performance.
Here are some of the most common mistakes to avoid.
Using the Wrong Denominator
One of the biggest mistakes is calculating engagement rate without understanding what the denominator represents.
Engagement rate can be calculated using:
- Reach
- Followers
- Impressions
- Views
- Other audience or exposure measurements
These formulas can produce very different results. Always identify which calculation method you are using before interpreting or comparing engagement rates.
Comparing Different Formulas
A 5% engagement rate based on reach is not necessarily equivalent to a 5% engagement rate based on followers or impressions.
When comparing posts, accounts, or campaigns, use the same formula and the same definition of engagement whenever possible.
Looking Only at Likes
Likes are easy to see, but they represent only one type of interaction.
Comments, shares, saves, clicks, replies, and other actions can provide additional information about how audiences respond to content.
A post with fewer likes may still be more valuable if it generates significantly more saves, shares, clicks, or meaningful conversations.
Comparing Different Social Media Platforms Directly
Engagement rates should not automatically be compared across Instagram, Facebook, LinkedIn, TikTok, and YouTube as if all platforms measure engagement in exactly the same way.
Each platform has different content formats, audiences, analytics, and interaction types. Use platform-specific context when evaluating performance.
Focusing on a Single Post
One post can perform unusually well or poorly because of timing, trends, distribution, audience behavior, or external events.
Instead of judging your strategy from one result, track engagement rate across multiple posts and look for consistent patterns.
Ignoring Content Format
A video, carousel, image, story, and text-based post can naturally generate different types and amounts of engagement.
Comparing every format against one benchmark can therefore create misleading conclusions.
A better approach is to compare similar content formats first, then evaluate which formats perform best for your audience.
Treating Engagement Rate as the Only Success Metric
A strong engagement rate does not automatically mean a campaign achieved its business objective.
Depending on the goal, you may also need to track:
- Website traffic
- Clicks
- Leads
- Sign-ups
- Sales
- Conversions
- Follower growth
- Brand awareness
For example, a promotional post may have a lower engagement rate than an entertaining post but generate significantly more sales. The "better" post depends on the campaign objective.
Chasing Engagement Instead of Creating Value
Trying to increase engagement at any cost can lead to low-quality content, excessive engagement bait, or posts that generate interactions without providing meaningful value.
The goal should be meaningful engagement from the right audience, not simply a bigger percentage on your analytics dashboard.
A good engagement strategy focuses on understanding why people interact with content and using those insights to create better content consistently.
Engagement Rate on Different Social Media Platforms
Engagement rate can be used across most major social media platforms, but the way engagement is measured and interpreted can differ from one platform to another. Each platform has its own content formats, audience behavior, analytics, and interaction types.
For this reason, avoid treating the same engagement rate formula as a universal standard across every network.
Instagram Engagement Rate
On Instagram, engagement can include interactions such as likes, comments, shares, saves, and other actions associated with posts, Reels, and Stories.
For individual posts, marketers may calculate engagement rate using reach or impressions. Account-level analysis may also use followers as the denominator.
For example, a brand could compare the engagement rates of its:
- Image posts
- Carousels
- Reels
- Stories
This can help identify which content formats generate stronger audience interaction.
Facebook Engagement Rate
Facebook provides several forms of interaction, including reactions, comments, shares, clicks, and interactions with different types of content.
When evaluating Facebook engagement, consider the objective of the content and the audience or exposure measurement used in the calculation. Comparing engagement based on reach with engagement based on impressions can produce different results.
LinkedIn Engagement Rate
LinkedIn engagement can include reactions, comments, reposts, clicks, and other interactions with posts.
Engagement rate can be useful for evaluating professional content such as:
- Industry insights
- Educational posts
- Company updates
- Thought leadership
- Product content
- Hiring-related content
When analyzing LinkedIn performance, consider both engagement and business outcomes such as profile visits, website clicks, leads, or other desired actions.
TikTok Engagement Rate
TikTok is heavily focused on video, making views an important metric when evaluating content performance.
Interactions can include likes, comments, shares, and other video-related actions. Marketers may therefore use views, reach, or another relevant measurement when calculating engagement rate.
Comparing engagement rates between TikTok videos can help identify which topics, creative approaches, hooks, or formats generate stronger audience responses.
YouTube Engagement Rate
On YouTube, engagement can involve likes, comments, shares, and other interactions with video content. Views are also an important part of understanding video performance.
For YouTube content, engagement should be evaluated alongside metrics such as:
- Views
- Watch time
- Average view duration
- Audience retention
- Click-through rate
- Subscribers gained
A video can generate strong engagement while still having poor retention, so looking at multiple metrics provides a more complete picture.
Why Platform-Specific Context Matters
A 5% engagement rate on one platform should not automatically be considered equivalent to a 5% rate on another.
Platforms differ in:
- How they define interactions
- How they distribute content
- How users consume content
- Which formats they prioritize
- How analytics are reported
- How engagement is calculated
The safest approach is to use a consistent formula within your own analysis and follow each platform's current analytics definitions when making platform-specific comparisons.
For brands managing multiple social networks, tools such as Bibby can simplify the publishing side of this process by allowing users to create and schedule different types of content across platforms from one workflow. This makes it easier to maintain a consistent content strategy while analyzing performance separately for each network.
Key Takeaways
Engagement rate is one of the most useful metrics for understanding how actively an audience responds to social media content. Rather than looking only at raw likes, comments, or shares, it puts those interactions into context by comparing them with a defined audience or exposure measurement.
The key points to remember are:
- Engagement rate measures audience interaction relative to reach, followers, impressions, views, or another relevant metric.
- There is no single engagement rate formula for every situation. The right calculation depends on the platform and purpose of the analysis.
- Engagement and engagement rate are different. Engagement counts interactions, while engagement rate puts those interactions into context.
- A high engagement rate does not automatically mean a successful campaign. Business goals such as clicks, leads, conversions, and sales should also be considered.
- There is no universal "good" engagement rate. Compare your performance with your own historical results and relevant benchmarks.
- Content relevance, format, quality, timing, consistency, captions, and audience composition can all influence engagement.
- Analyzing engagement patterns can reveal what your audience actually responds to, helping you create a stronger social media strategy.
- Consistent publishing makes testing and optimization easier. Social media automation tools such as Bibby can help streamline content creation, caption generation, scheduling, and publishing across multiple platforms.
Ultimately, engagement rate is not simply a number to make bigger. It is a way to understand whether your content is creating meaningful interaction with the audience you want to reach.
Continue learning with related dictionary entries on engagement, reach, impressions, CTR, conversion rate, followers, captions, and call to action—or browse the social media dictionary. Then start a free Bibby trial to create, caption, and schedule posts across your channels.