
Common examples: follower counts, likes, impressions, page views, and video views when they are not tied to a meaningful outcome.
10,000 new followers can sound like a win. If they never engage, visit, become leads, or buy, the number says little about growth. That does not make likes or views useless. Value depends on the goal and how you use the data. Awareness may reasonably track reach and impressions. Lead gen needs qualified leads, conversions, and cost per acquisition.
The job is to separate surface activity from impact—not to ignore large numbers, but to put them in context.
Bibby does not replace Insights or report ROI. After you publish, measure in native Insights or your analytics stack. Generate captions and schedule images, carousels, videos, and Stories on Facebook, Instagram, LinkedIn, YouTube, and TikTok—not X. See the dictionary, blog, and free tools.
Vanity Metrics in Simple Terms
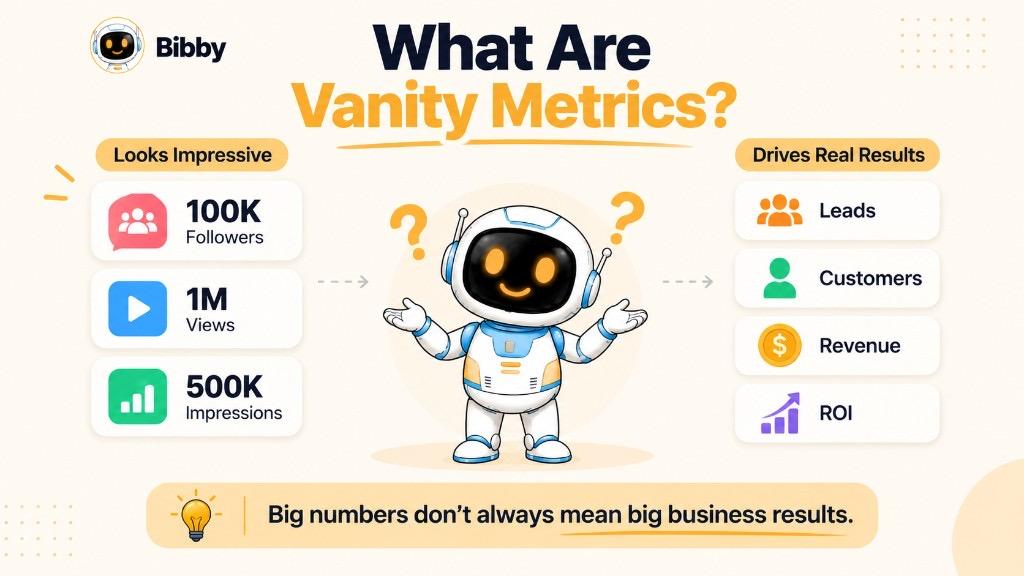
They often measure attention, activity, or audience size—not the business result.
A campaign can earn 500,000 impressions, 20,000 likes, and 10,000 new followers without proving traffic, qualified leads, sales, or revenue.
Vanity metrics = “How much attention did we get?”
Actionable metrics = “What did that attention accomplish?”
A growing follower count shows a larger audience. For lead gen you also need clicks, forms, demos, or customers. The same idea applies to sites (visits without conversions), apps (downloads without active users), and email (list growth without opens, clicks, or conversions).
A metric is not a vanity metric just because it is large or measures engagement. Usefulness depends on objective, audience, timeframe, and whether it helps you understand what happened or decide what to do next.
A Simple Example
| Metric | Campaign A | Campaign B |
|---|---|---|
| Impressions | 500,000 | 150,000 |
| Likes | 25,000 | 7,000 |
| Website visits | 500 | 2,000 |
| Qualified leads | 10 | 80 |
| Customers | 1 | 15 |
Campaign A wins the scoreboard. Campaign B wins the business. Bigger is not automatically better. Start with the goal, then pick numbers that answer it.
What Is an Example of a Vanity Metric?
A classic example is follower count. 100,000 followers looks impressive; it does not tell you interest, visits, leads, or purchases. Likes, impressions, page views, and video views can be the same: useful for activity, vanity when treated as proof of success without an objective.
| Metric | Why it can mislead | A more useful question |
|---|---|---|
| Followers | Size ≠ engagement or customers | Are they becoming prospects or customers? |
| Likes | Reaction ≠ business action | Did the post encourage a valuable action? |
| Impressions | Display ≠ outcome | Did exposure lead to traffic, leads, or conversions? |
| Page views | Volume ≠ quality | Are visitors taking the goal action? |
| Video views | Count ≠ intent | Watch quality, engagement, or conversion? |
| Downloads | Install ≠ use | Activation and retention? |
| Email subscribers | List size ≠ activity | Opens, clicks, conversions? |
| Total engagement | A blend can hide quality | Which interactions serve the objective? |
These are not automatically vanity metrics. Follower growth can matter for audience building. Impressions can matter for exposure. Views can describe distribution. Downloads can matter at launch.
“We gained 20,000 Instagram followers” describes growth. It does not prove revenue. Stronger: 20,000 followers → 8,000 profile visits → 1,200 site visits → 140 leads → 25 customers.
Ask: Does this metric show progress toward the goal? Awareness → reach and impressions. Lead gen → qualified leads, conversion rate, cost per lead. Sales → revenue, conversion rate, CAC, ROI.
Vanity Metrics in Social Media
Platforms surface followers, likes, comments, shares, impressions, reach, profile visits, and views in a few clicks. The hard part is which numbers match the goal.
A post with 100,000 views shows distribution, not visits, sign-ups, demos, or sales.
- Followers — size, not quality or customer value
- Likes — a reaction, not purchase intent
- Impressions — times shown, not action
- Reach — accounts exposed, not what happened next
- Video views — platform-defined views, not always attention or conversion
- Comments / shares / subscribers — conversation, spread, or list size—not automatically revenue
Awareness: reach, impressions, completion, audience growth.
Lead gen: clicks, landing-page conversions, qualified leads, cost per lead.
Sales: conversions, revenue, CAC, ROAS or other ROI—calculated outside Bibby.
10,000 Instagram followers can be a milestone for a new creator. For B2B lead gen, the question is how many become prospects.
Do not treat every engagement number as meaningless. A spike in shares, reach, or followers is a signal. Next: why, and does it matter?
Content → attention → engagement → action → conversion → business outcome.
| Campaign A | Campaign B | |
|---|---|---|
| Impressions | 500,000 | 180,000 |
| Likes | 30,000 | 9,000 |
| New followers | 8,000 | 2,500 |
| Site visits | 300 | 2,000 |
| Qualified leads | 12 | 95 |
If both were lead-gen campaigns, B is stronger evidence. Read social numbers in context, not as a biggest-number scoreboard. Review them in Insights or analytics tools—not as a Bibby dashboard.
Are Likes and Followers Vanity Metrics?
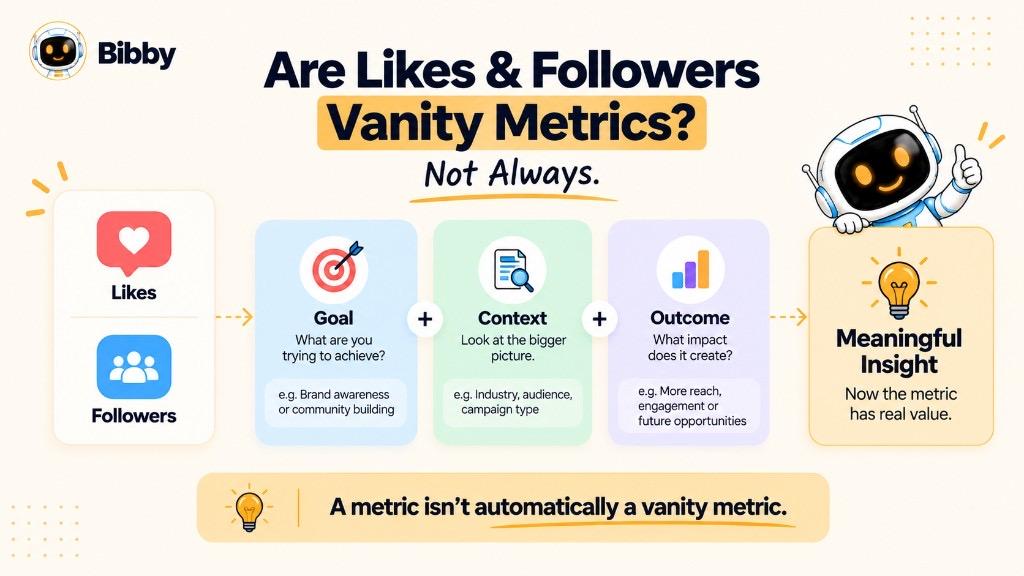
They can be. They are not automatically. Growth shows an expanding audience. Likes show interaction. The problem is treating them as business success without “what happened next.”
10,000 → 50,000 followers is real growth. Alone it cannot answer: right audience? future engagement? visits? sign-ups? leads? revenue?
Follower growth → profile visits → website visits → leads → customers
Post A: 20,000 likes, 100 visits, 5 leads.
Post B: 2,000 likes, 700 visits, 60 leads.
For lead gen, likes alone pick the wrong winner.
Followers help with audience growth, community, potential distribution, and size over time. Likes help compare posts, topics, and formats. They get better next to engagement rate, clicks, conversions, qualified leads, CAC, or revenue.
Ask what the numbers say about the audience and the goal—not only “how many.” Isolated from the desired outcome, they become vanity metrics.
Vanity Metrics vs. Actionable Metrics
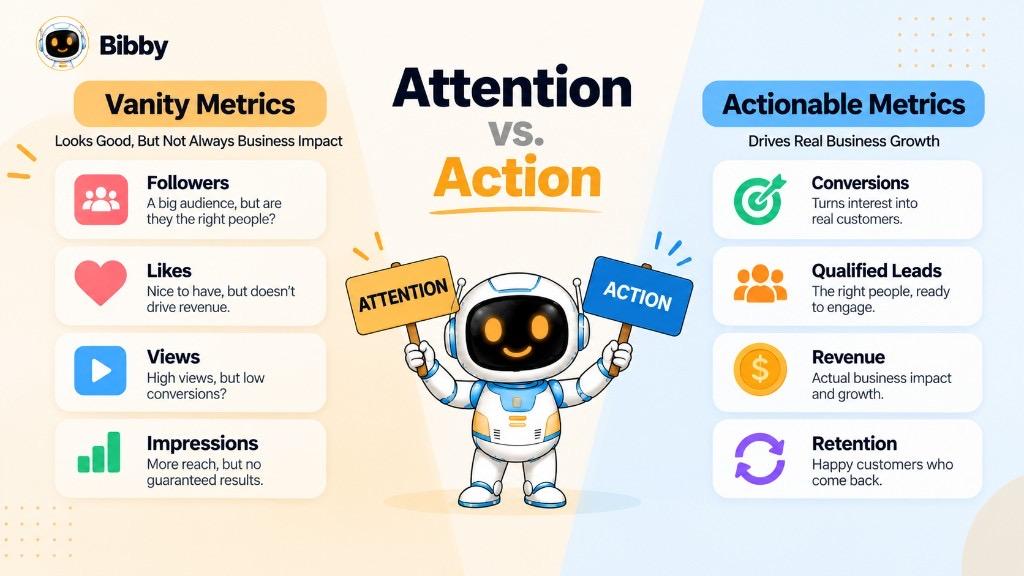
Vanity metrics show something is happening. Actionable metrics help you evaluate, decide, or optimize.
| Vanity-oriented | Actionable | Helps you see |
|---|---|---|
| Followers | Qualified social leads | Whether growth feeds lead gen |
| Likes | Engagement rate or meaningful interactions | Response relative to reach or audience |
| Impressions | Conversions attributed to the campaign | Whether exposure drove an action |
| Page views | Conversion rate | How often visitors complete the action |
| Video views | Watch time or completion | Depth of consumption |
| Downloads | Activation and retention | Real use |
| Email subscribers | CTR and conversion | Whether the list acts |
| Total engagement | CAC or revenue | Business value |
The left column is not useless. It usually needs context.
“1 million impressions” is exposure. If the goal was leads, the report is incomplete.
Actionable for lead gen: qualified leads, conversion rate, cost per lead, landing-page conversion, CAC, revenue. For awareness, reach, impressions, audience growth, and completion can be the right primary set.
Do not split the world into good vs. bad metrics. Impressions can answer distribution and fail as a sales score. Followers can track growth and fail as acquisition proof.
Vanity: “What number can we show?”
Actionable: “What does it tell us, and what do we do?”
Use both: surface metrics for behavior and distribution; outcome metrics for the objective.
Vanity Metrics vs. Actionable Metrics: Examples
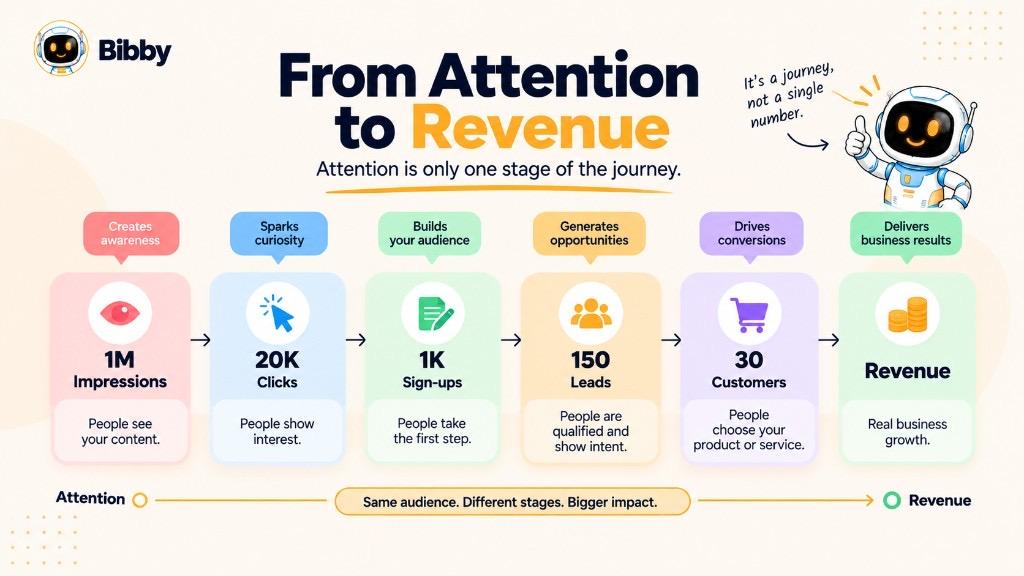
Social: 500,000 impressions, 25,000 likes, 8,000 followers show exposure. For lead gen add clicks, landing-page conversion, qualified leads, CPL, customers.
Ecommerce: 500,000 visits ≠ sales. Add conversion rate, orders, AOV, revenue, CAC, repeat purchase.
SaaS / services: 20,000 sign-ups ≠ paid users. Add activation, key actions, trial-to-paid, retention, churn, MRR, CAC. 20,000 sign-ups, 1,000 activations, 100 paying customers is a partial launch story.
Content: 100,000 page views ≠ growth. Add relevant organic traffic, newsletter sign-ups, demos, assisted conversions, influenced revenue. Awareness can live on traffic; lead gen cannot.
YouTube: 1 million views and 40,000 likes ≠ a sales win. Add watch time, site visits, CTA clicks, sign-ups, customers.
Surface activity → meaningful action → business outcome. Example: 1 million impressions → 20,000 clicks → 1,000 sign-ups → 150 customers → $30,000 revenue. Awareness campaigns may stop at reach on purpose. Right metrics depend on goal, stage, audience, and model.
A metric is more actionable when it explains what happened, why, or what to do next.
Common Vanity Metrics
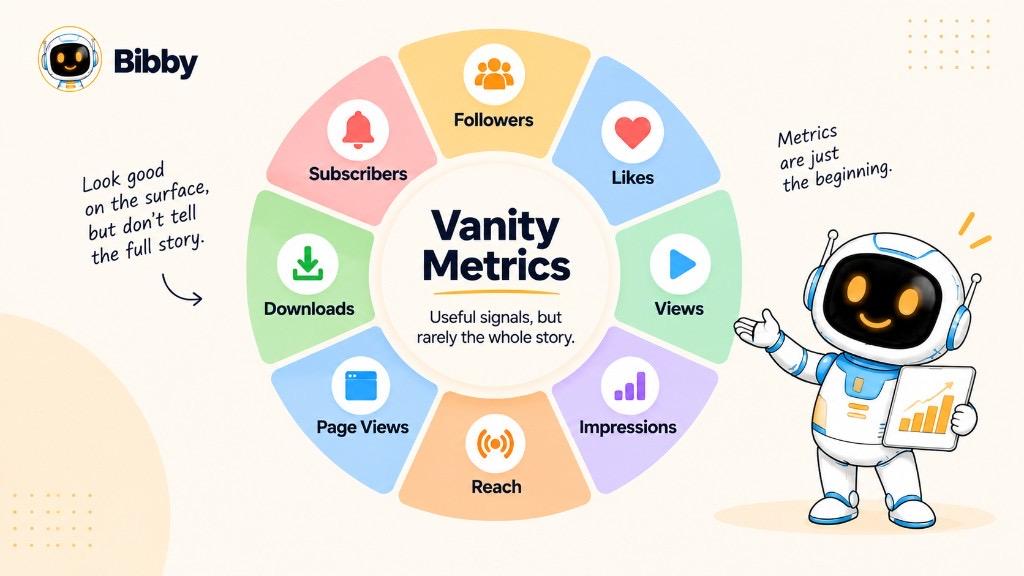
A metric is not a vanity metric by default. Usefulness depends on the objective.
Social: followers, likes, impressions, reach, video views, comments, shares, subscribers.
Website: page views, visitors, sessions, unique visitors, traffic, time on site without context. 1 million visits still needs quality and next actions.
Marketing: campaign impressions, clicks without conversion, subscriber count, sends, downloads, “engagement,” ad reach, traffic. 500,000 emails can be mostly inactive.
Product / SaaS: registrations, downloads, trials, total users.
Advertising: impressions, reach, clicks, views, engagement, page interactions—pair with conversion rate, CAC, revenue, ROAS for a sales campaign. Paid social is a separate decision from organic posts.
Reach can answer awareness; follower growth can answer expansion. Pair: followers + engagement rate + visits + qualified leads, or impressions + clicks + conversion rate + revenue.
Ask: What decision can we make because this number changed? If unclear, add context. Growth Insights and the report card are not a vanity-metric or ROI dashboard.
Why Are Vanity Metrics Misleading?
The issue is activity without enough impact context—when the number becomes the main grade.
- They can look better than they are — 1 million impressions or 50,000 likes ≠ qualified traffic, leads, or revenue.
- They often lack context — goal, audience, period, benchmark, next action, outcome. 100,000 visitors means different things for awareness vs. ecommerce.
- They encourage the wrong optimization — teams chase likes or followers when the company needed qualified leads.
- They hide conversion problems — 500,000 impressions, 30,000 likes, 25 leads is a different story if the goal was lead gen.
- Busy reports, weak questions — decision-makers need audience fit, traffic, leads, conversion, which content, what to change.
- Short-term thinking — likes in hours vs. retention, repeat purchase, pipeline, revenue over weeks.
- Distraction from the objective — awareness, audience, leads, sales, adoption, retention, usage. The most visible metric is not always the relevant one.
Do not label every follower, like, impression, or view as vanity. They mislead when isolated from the objective. Connect attention → engagement → action → conversion → outcome.
Are Vanity Metrics Always Bad?
No. Followers, likes, impressions, reach, views, and traffic can be useful. The failure is treating them as complete proof when they do not measure the goal.
Impressions can be the right primary for awareness. Follower growth can describe expansion. The same numbers are weaker as the main sales score.
They can be leading indicators: engagement for topic fit, reach for distribution, subscribers for future audience. A leading indicator is not a final outcome.
A new creator may center followers and engagement. A B2B SaaS lead campaign may treat them as supporting data next to qualified leads, conversion, pipeline, and revenue.
Ask: What question does it answer? Which objective? What extra metric explains impact? Keep useful data; stop celebrating numbers that do not show progress.
How to Identify a Vanity Metric
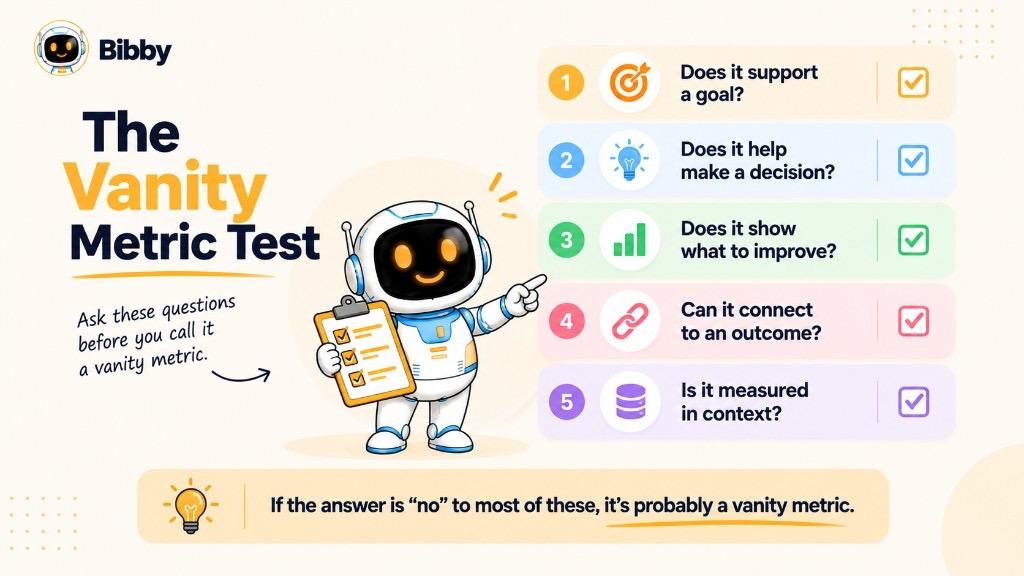
- Goal — awareness, leads, sales, conversions, active users, retention, revenue?
- Decision — if it moves, what changes? 10,000 likes with no strategy implication has limited value.
- Improvement — traffic +40% with flat conversions points at the page, not the traffic win. Relationships beat single numbers.
- Outcome path — social: impression → engagement → profile → site → lead → customer. App: download → activation → usage → retention → paid. Ecommerce: visit → product view → cart → purchase → repeat.
- Right audience — 100,000 views outside the market may not help. Quality can beat size.
- Context — vs. last month, qualified share, conversion, channel, cost, outcome. 10,000 likes on 5 million followers with a falling engagement rate is not a win.
The Vanity Metric Test
Goal → metric → action → outcome. If it does not connect to an objective or a decision, it is functioning as a vanity metric.
“15,000 new followers” is growth. “15,000 followers, 4,000 extra visits, 180 qualified leads, 30 customers” is a journey.
Shortcut: Why does it matter? What decision? What outcome? If you cannot answer, pair it—do not always delete it.
What Should You Track Instead of Vanity Metrics?
Do not stop tracking impressive numbers. Track numbers that connect activity to the objective.
| Goal | Consider | What it can show |
|---|---|---|
| Brand awareness | Reach, qualified reach, audience growth, brand search | Exposure and awareness |
| Social engagement | Engagement rate, meaningful interactions, saves, shares | How people respond |
| Website traffic | Qualified traffic, landing-page engagement, conversion rate | Relevance and action |
| Lead generation | Qualified leads, conversion rate, cost per lead | Potential customers |
| Sales | Purchases, revenue, conversion rate, CAC | Commercial results |
| Retention | Retention, repeat purchase, churn | Ongoing value |
| SaaS growth | Activation, retention, paid conversion, recurring revenue | Acquisition to value |
Track conversion rate, not traffic alone. Track qualified leads, not audience size alone. Track revenue and CAC (plus AOV, LTV, ROAS as the model requires). Track retention, not sign-ups alone. Track meaningful engagement (rate, saves, shares, comments, profile visits, clicks, completion, repeat)—not a blended total.
Define the objective before the metrics. Lead gen: primary = qualified leads, conversion rate, CPL; supporting = reach, impressions, clicks, engagement. Awareness: primary = relevant reach, audience growth, brand search; supporting = impressions, views, engagement.
Level 1 outcomes — revenue, customers, qualified leads, retention.
Level 2 behavior — conversion rate, site actions, activation, purchases.
Level 3 attention — reach, impressions, views, likes, followers.
The best metric is the one that shows progress toward the goal.
Vanity Metrics in Social Media Marketing
“2 million impressions this month” is exposure. It does not prove qualified traffic, leads, or sales.
| Objective | Monitor | Supporting |
|---|---|---|
| Awareness | Relevant reach, audience growth, brand search | Impressions, views, engagement |
| Engagement | Engagement rate, shares, saves, meaningful interactions | Likes, comments, reach |
| Website traffic | Qualified visits, landing-page engagement, clicks | Reach, impressions, link clicks |
| Leads | Qualified leads, conversion rate, CPL | Clicks, profile visits, engagement |
| Sales | Purchases, revenue, conversion rate, acquisition cost | Clicks, traffic, engagement |
| Community | Active audience, meaningful and returning engagement | Followers, likes, comments |
The Social Media Funnel
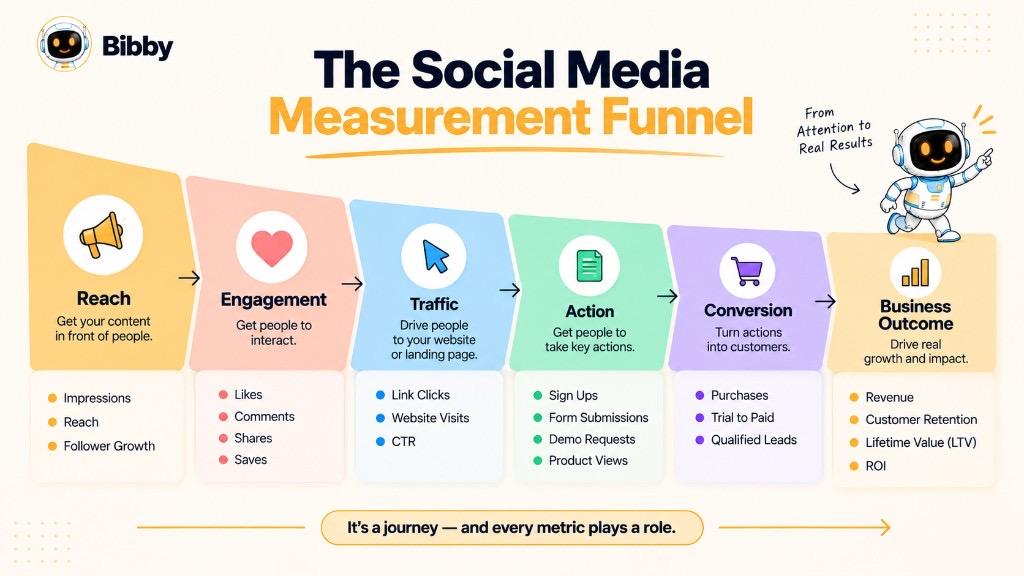
Reach → engagement → traffic → action → conversion → business outcome. Awareness campaigns may stay near the top on purpose. Judge them by the stated purpose.
LinkedIn lead-gen example: 400,000 impressions, 18,000 reactions, 3,500 followers, 1,200 visits, 120 forms, 65 qualified leads, 12 customers. Each number is a stage. For lead gen, the last stages matter most.
Do not delete engagement. High shares, saves, or rate changes can feed a loop: pattern → more of that content → test → measure downstream.
How to Avoid Vanity-Metric Reporting
Attention: reach, impressions, views, followers.
Engagement: likes, comments, shares, saves, rate.
Action: clicks, profile visits, site visits, forms, sign-ups.
Outcome: qualified leads, customers, revenue, CAC, ROI.
A million impressions and a hundred customers are not the same type of result.
Content → attention → engagement → action → conversion → value. When you can trace that, surface metrics become supporting signals.
Vanity Metrics by Social Media Platform
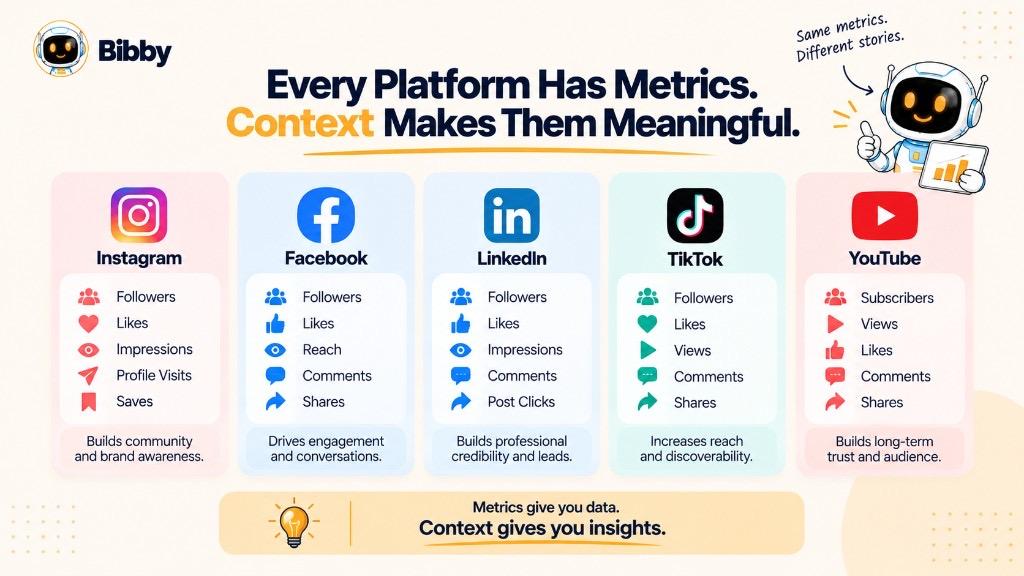
Platforms measure differently. Do not treat a number as business success by default.
Instagram — followers, likes, comments, reach, impressions, Reel views, shares, saves, profile activity. For lead gen: reach → profile activity → visits → leads → customers.
Facebook — followers, reactions, comments, shares, reach, impressions, video views, link clicks. For ecommerce, add purchases, conversion rate, revenue, CAC.
LinkedIn — followers, impressions, reactions, comments, reposts, video views, page visits, clicks. For B2B add demos, qualified leads, opportunities, pipeline, CAC, revenue.
TikTok — views, likes, comments, shares, followers, profile views. Fast reach ≠ buyers. Add clicks, traffic, sign-ups, purchases, conversion rate.
YouTube — subscribers, views, likes, comments, watch time, retention, CTR. For customers add traffic, clicks, sign-ups, leads, sales, attributed revenue.
100,000 TikTok views ≠ 100,000 LinkedIn impressions. 10,000 new followers can mean more for a creator than for a B2B pipeline team.
Compare platforms on shared objectives (awareness, engagement, traffic, leads, sales)—not raw audience size. Followers, reactions, impressions, views, and subscribers become vanity metrics when they are final proof without the objective.
From Vanity Metrics to Actionable Social Media Data
Automation speeds publishing. It is not measurement.
Create → publish → measure → analyze → optimize → repeat.
- Objective first — awareness, education, traffic, community, leads, product, sales, sign-ups.
- Publish enough to see patterns — short video vs. carousels vs. topics vs. times. Consistency is for learning, not volume for its own sake.
- Measure the journey — attention, engagement, action, conversion, outcome.
- Read relationships — reach up, visits flat → audience or CTA. Engagement up, conversions down → wrong people.
- Decide — more educational carousels if they save and visit; fix offer or page if engagement is high and leads are not.
- Loop — publish → measure → learn → adjust.
Example: 30 posts, 2 million impressions, 100,000 likes, 15,000 followers—then 12,000 visits, 800 sign-ups, 250 qualified leads, 40 customers. Use engagement as supporting data.
Signal ≠ conclusion. Prefer: “1 million impressions, 12,000 visits, 300 qualified leads; Topic A drove the best qualified traffic, so we will test more of it.”
Goal → content → distribution → attention → engagement → action → conversion → analysis → optimization. Vanity metrics live in attention and engagement. Do not stop there.
Using Bibby for More Than Vanity Metrics
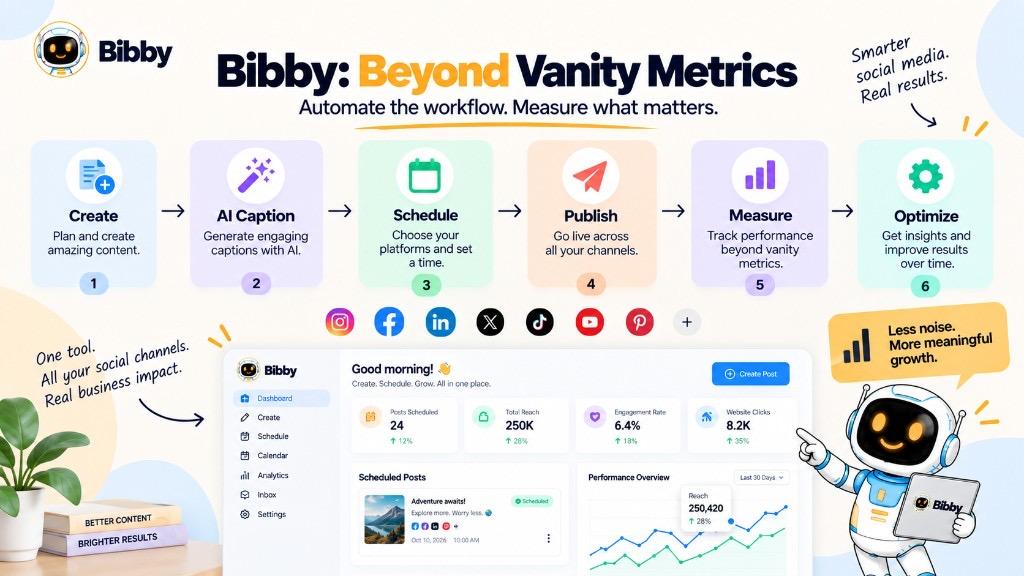
Automation is not a scoreboard. More posts ≠ better results.
In Bibby you can upload or generate visuals, pick a posting style, generate captions, organize a campaign and brand kit in chat, then schedule images, carousels, videos, and Stories at AI-optimized times on the five channels. Plans and sign up; see resources and help.
A scheduled post is an activity. Judge it in Insights against the objective. Volume of 100 automated posts does not answer which content, audience, traffic, leads, or formats to keep.
Create → schedule → publish plus measure → analyze → learn → optimize. If educational carousels earn more saves and qualified visits, test related topics and hooks—then check downstream actions. Likes, saves, reach, and impressions stay signals, not the definition of success.
Automate the work. Measure the outcome outside Bibby. Learn. Improve the strategy.
Vanity Metrics Example
A SaaS team runs 30 days of educational posts, short videos, and product content for qualified leads.
Attention: 1.2 million impressions, 85,000 video views, 18,000 likes, 6,000 followers, 4,500 comments and shares.
Downstream: 8,000 visits, 420 sign-ups, 180 qualified leads, 35 opportunities, 12 customers.
| Measurement | Result | Shows |
|---|---|---|
| Impressions | 1.2 million | Exposure |
| Video views | 85,000 | Consumption |
| Likes | 18,000 | Interaction |
| New followers | 6,000 | Audience growth |
| Website visits | 8,000 | Traffic |
| Sign-ups | 420 | Desired action |
| Qualified leads | 180 | Potential value |
| Opportunities | 35 | Sales process |
| New customers | 12 | Commercial outcome |
A promo video: 300,000 impressions, 15,000 views, 5,000 likes, 2,000 followers, 15 qualified leads.
An educational carousel: 90,000 impressions, 4,000 likes, 800 saves, 500 visits, 45 qualified leads.
For lead gen, the carousel’s lead data deserves extra weight. Next: which content, topics, platforms, CTAs, and drop-off points? Then test.
If the same company runs an awareness campaign: 2 million impressions, 800,000 reach, 100,000 views, 10,000 followers and few conversions can still match the brief.
Impressions measure exposure. Followers measure growth. Likes measure interaction. Conversions measure desired actions. Revenue measures money. Use several relevant numbers.
Vanity Metrics vs. North Star Metrics
A North Star metric is a central measure of the value the company wants to create—not “good vs. bad” vs. vanity, but purpose.
Streaming might track meaningful consumption; a marketplace, successful transactions; SaaS, active customers getting value; ecommerce, completed purchases.
| Vanity-style | North Star |
|---|---|
| Surface activity | Central outcome or value |
| Impressive without context | Tied to a broader objective |
| Often isolated | Supported by other metrics |
| “How much activity?” | “Are we creating meaningful value?” |
| Supporting signals | Aligns the org |
100,000 followers describe size. Qualified leads → opportunities → customers describes value. Keep followers as a supporting growth metric.
North Star still needs traffic, sign-ups, activation, adoption, retention, churn, paid conversion, revenue: North Star → supporting → diagnostic.
A 50% follower bump is not the right primary if the goal is retention or pipeline. Use both types carefully along the journey.
Vanity Metrics vs. KPIs
They are not opposites. Vanity describes how a number is used. A KPI is chosen on purpose to track an important objective.
Lead gen KPIs: qualified leads, conversion rate, CPL, SQLs. Ecommerce: purchase conversion, revenue, AOV, CAC, repeat. SaaS: activation, retention, churn, paid conversion, MRR.
| Vanity-style | KPI |
|---|---|
| Impressive without context | Tied to an objective |
| Activity or audience size | Progress toward a defined goal |
| May not drive a decision | Should evaluate performance |
| Incomplete alone | Has a defined role |
| Can be supporting | Selected because it matters |
Follower growth can be a KPI for relevant audience building. As “proof” a sales campaign worked with no lead or customer link, it behaves like a vanity metric.
Objective: 200 qualified social leads a quarter. KPI: qualified social leads. Supporting: reach, impressions, engagement rate, clicks, sessions, landing-page conversion, CPL.
Objective → KPI → supporting → analysis → decision. Labeling impressions a KPI does not make them the right sales measure. Ask: which objective, why, timeframe, benchmark, what we do if it moves.
Outcome → primary KPI → supporting → diagnostic. Example: customers → qualified leads → conversion rate → clicks → reach and engagement.
Common Mistakes When Using Vanity Metrics
- Celebrating big numbers without context — 2 million impressions needs audience, comparison, actions, leads, conversions.
- Engagement = business success — high likes, few conversions.
- Follower growth over quality — fit, future engagement, visits, leads, customers. A smaller relevant audience can outperform a huge mismatch.
- Measuring everything — use primary / supporting / diagnostic.
- Comparisons without context — volume, audience, budget, algorithm, season, format.
- Optimizing what is easy — likes are automatic; outcomes often live in other systems.
- Ignoring conversion — impression → click → visit → sign-up → lead → customer.
- Correlation as causation — followers and revenue can rise together for ads, season, product, search, sales.
- One post as strategy — viral views may not repeat; a quiet post can still generate leads. Look for patterns.
- Reports without a decision — “educational posts drive qualified traffic → test more and watch lead quality.”
Define objective → pick primary KPI → add supporting metrics → add context → look for patterns → act.
How Should You Report Vanity Metrics?
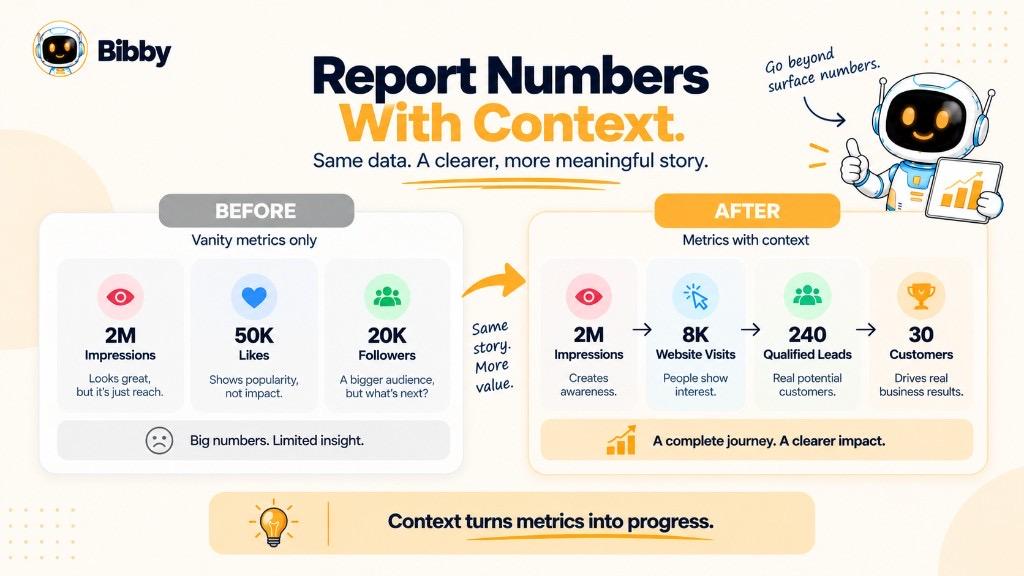
Keep them. Add objective, benchmark, actions, outcomes.
Metric → context → benchmark → outcome → decision.
Start: “Instagram followers +20%.” Add: during a 30-day awareness campaign. Compare: vs. 8% last period. Then: +15% profile visits, +10% site traffic, 180 qualified leads, 30 customers.
Weak: “2 million impressions and 50,000 likes.”
Stronger: “2 million impressions and 50,000 likes, 35% more people than last campaign, 8,000 visits, 240 qualified leads. Educational carousels drove the most qualified traffic; the next campaign will test more of that format.” Exposure → engagement → traffic → leads → decision.
Primary / supporting / diagnostic. Do not hide a lead-gen miss behind likes. Report trends, not one snapshot. End in an action: keep a format, test an audience, change a CTA, fix a page, shift spend, stop what does not serve the goal.
Measure → context → analyze → learn → decide → act. A good report shows what happened, why it matters, and what is next.
Key Takeaways
- Impressive numbers do not automatically prove business success.
- A metric is not inherently vanity—goal, audience, timeframe, and interpretation decide.
- Context and benchmarks make numbers usable.
- Actionable metrics support decisions: conversion rate, qualified leads, CAC, retention, revenue.
- Social is a journey: reach → engagement → action → conversion → outcome.
- Likes and followers can be signals, not proof.
- Match metrics to the objective.
- Automation (including Bibby) does not replace measurement in Insights.
Next: KPIs, ROI, engagement rate, reach, and impressions.