
A Key Performance Indicator (KPI) is a measurable value that shows whether your social media strategy is moving toward an important business goal.
If you manage social media, KPIs help you understand more than how many likes or views a post receives—they show whether your content and campaigns are actually producing meaningful results. The right KPI connects your social media activity to a specific objective, making it easier to measure performance, identify what is working, and decide what to improve.
In this article, you will learn:
- What KPI stands for and how it differs from an ordinary metric
- Common social media KPIs by goal and platform
- How to choose, measure, and track KPIs without treating every number as success
What Does KPI Stand For?
KPI stands for Key Performance Indicator.
A KPI is a measurable value used to determine whether a person, team, campaign, or business is making progress toward an important objective.
Each word in the term has a purpose:
- Key: The measurement is important to the goal you are trying to achieve.
- Performance: It shows how effectively something is performing.
- Indicator: It provides a signal about whether you are moving toward the desired outcome.
For example, if your goal is to generate more leads from social media, the number of qualified leads generated from social channels could be a KPI. If your goal is to increase brand awareness, reach or impressions may be more relevant.
The important point is that a KPI is not simply any number you can measure. It is a measurement selected because it helps you evaluate progress toward a specific goal.
What Is a KPI?
A Key Performance Indicator (KPI) is a measurable value that helps you determine whether you are achieving a specific objective.
In simple terms, a KPI answers the question: “Are we making progress toward the result we want?”
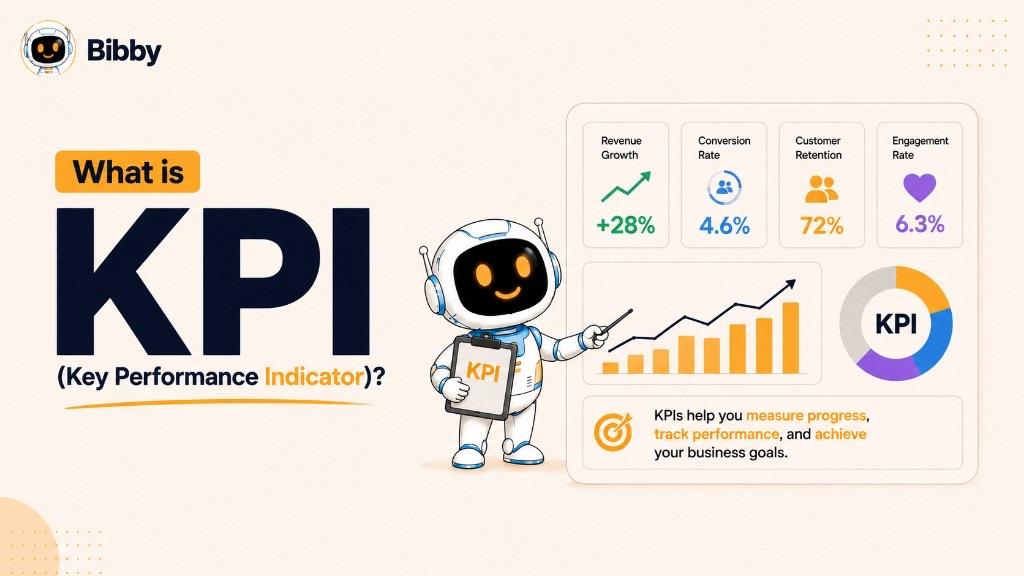
For example, imagine your social media goal is to generate 100 qualified leads from LinkedIn in one month. You might track impressions, likes, comments, clicks, and website visits along the way. However, qualified leads generated from LinkedIn would be a KPI because it directly measures progress toward your business goal.
This distinction matters because social media platforms provide hundreds of numbers you can track. More data does not necessarily mean better decision-making. The most useful KPIs are the measurements that connect your social media activity to an outcome that actually matters.
A useful way to think about it is:
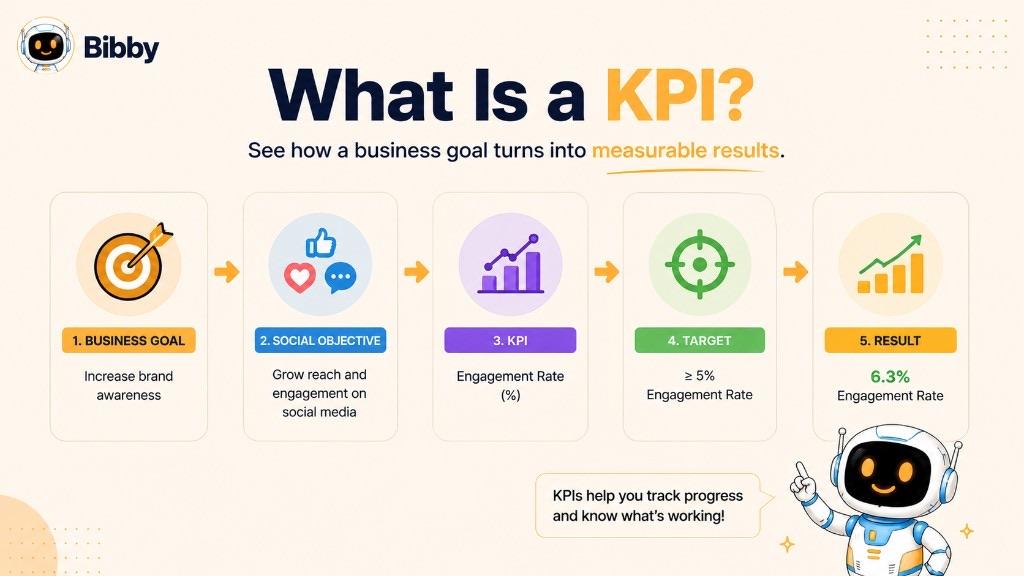
Business goal → Social media objective → KPI → Target → Result
For example:
Business goal: Generate more customers
Social media objective: Increase qualified website traffic
KPI: Social media conversion rate
Target: 5% conversion rate
Result: 4.2% conversion rate
In this example, the KPI gives you a clear way to evaluate performance against a defined target.
KPI vs. Metric: What's the Difference?
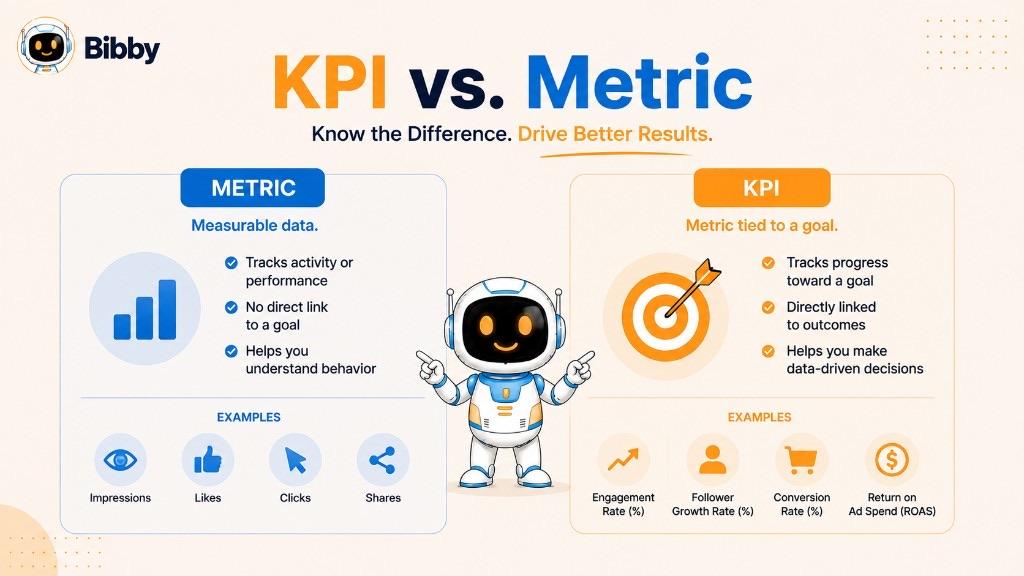
A metric is any measurable data point, while a KPI is a metric that has been specifically chosen to measure progress toward an important goal.
In social media, you can measure almost everything: likes, comments, impressions, followers, video views, clicks, shares, saves, and more. These numbers can provide useful information, but they don't automatically qualify as KPIs.
The difference comes down to purpose.
| Metric | KPI | |
|---|---|---|
| What it is | A measurable data point | A strategically important measurement |
| Purpose | Provides information about performance | Measures progress toward a specific objective |
| Example | Post impressions | Qualified leads generated |
| Requires a goal? | Not necessarily | Yes |
| Used for decision-making? | Sometimes | Typically |
A simple example
Suppose your goal is to generate more leads from Instagram.
You might track:
- Followers: 25,000
- Reach: 180,000
- Likes: 4,500
- Link clicks: 2,100
- Leads: 120
All five are metrics. But if your primary objective is lead generation, 120 leads may be the most important KPI because it directly reflects progress toward that objective.
The same metric can also be a KPI in one situation and simply a supporting metric in another. For example, follower growth could be a KPI for a brand focused on building a new audience, but it may be far less important for a campaign whose primary goal is generating sales.
Metrics tell you what happened; KPIs help you determine whether what happened is helping you reach your goal.
What Is a Social Media KPI?
A social media KPI is a measurable indicator used to determine whether your social media activity is achieving a specific marketing or business objective.
Social platforms generate a huge amount of performance data, but not every number deserves to be treated as a KPI. The right KPI depends on what you are trying to accomplish.
For example, a business focused on building brand awareness might use reach as a KPI. A business trying to generate website traffic might prioritize click-through rate (CTR), while a company focused on sales may care more about conversions or social-attributed revenue.
Social media goals and their KPIs
| Social media goal | Potential KPI |
|---|---|
| Increase brand awareness | Reach or qualified impressions |
| Increase engagement | Engagement rate |
| Drive website traffic | Click-through rate (CTR) |
| Generate leads | Qualified leads from social |
| Increase sales | Social-attributed conversions or revenue |
| Grow an audience | Follower growth rate |
| Improve customer service | Response time or resolution rate |
The important thing is to choose a KPI after defining the objective, not before.
For instance, tracking follower growth simply because it is easy to measure does not make it a useful KPI. If your actual goal is to generate qualified leads, a growing follower count may tell you very little about whether the strategy is succeeding.
A strong social media KPI connects three things:
Goal → Measurement → Business outcome
This connection turns social media analytics from a collection of numbers into information you can use to make better decisions.
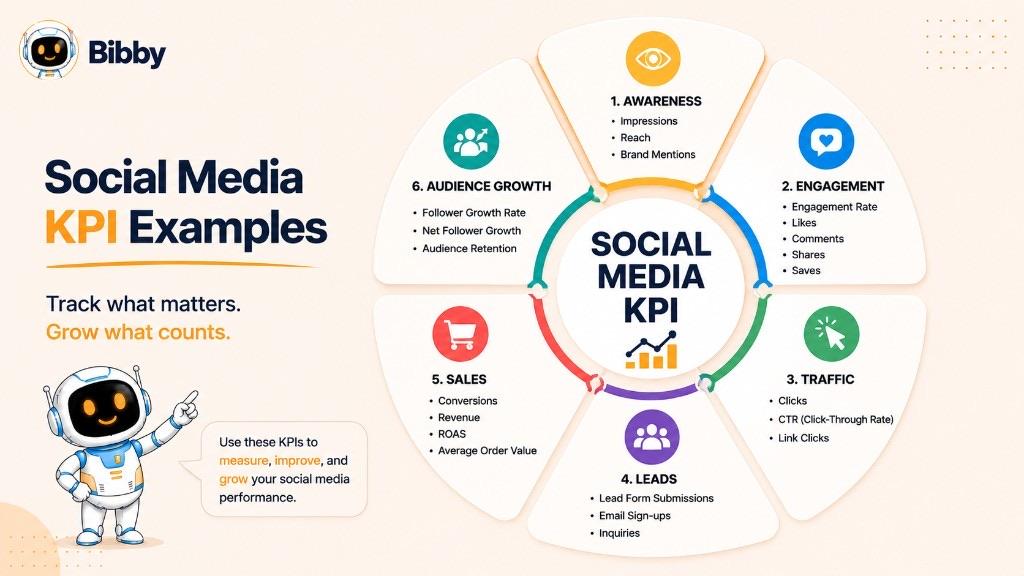
Social Media KPI Examples
The best social media KPI depends on what you want your content or campaign to accomplish. Instead of tracking every available number, choose the measurements that provide a clear signal about progress toward your specific objective.
Awareness KPIs
If your goal is to get your brand or content in front of more relevant people, common KPIs include:
- Reach: The number of unique users who saw your content.
- Impressions: The total number of times content was displayed.
- Reach growth rate: How quickly your potential audience is growing.
- Video views: The number of times your video content was viewed.
Reach and impressions can help evaluate awareness, but the most useful choice depends on how your campaign defines success.
Engagement KPIs
If your goal is to encourage people to interact with your content, consider:
- Engagement rate: The percentage of people who interact with your content relative to the chosen audience or exposure measure.
- Comments: Indicates active audience participation.
- Shares: Shows whether people find content valuable enough to distribute to others.
- Saves: Particularly useful for educational, inspirational, or reference-style content.
- Average engagement per post: Helps compare content performance across posts.
Engagement is more meaningful when evaluated in relation to your audience size, reach, and campaign objective rather than as a standalone number.
Traffic KPIs
If social media is primarily being used to drive visitors to your website, useful KPIs include:
- Link clicks
- Click-through rate (CTR)
- Social referral traffic
- Landing-page visits
CTR can be particularly useful because it measures how effectively your content encourages people to take the next step.
Lead Generation KPIs
For campaigns designed to generate prospects, common KPIs include:
- Leads generated
- Qualified leads
- Lead conversion rate
- Cost per lead
- Social-sourced leads
For lead-generation campaigns, qualified leads are often more meaningful than simply counting every form submission.
Sales and Revenue KPIs
When the ultimate objective is revenue, you may track:
- Conversions
- Conversion rate
- Social-attributed revenue
- Customer acquisition cost
- Return on ad spend (ROAS) and ROI
These KPIs connect social media activity more directly to financial outcomes.
Audience Growth KPIs
For brands focused on building an audience, useful measurements include:
- New followers
- Follower growth rate
- Audience growth by platform
- Audience growth within a target demographic
Follower count alone can be misleading. A smaller audience that consistently engages with your content or converts into customers may be more valuable than a much larger inactive audience.
Customer Service KPIs
Social media can also function as a customer support channel. Relevant KPIs may include:
- Average response time
- Response rate
- Resolution rate
- Customer satisfaction
The best social media KPI is the one that most clearly measures progress toward your current goal.
Social Media KPI Examples by Platform
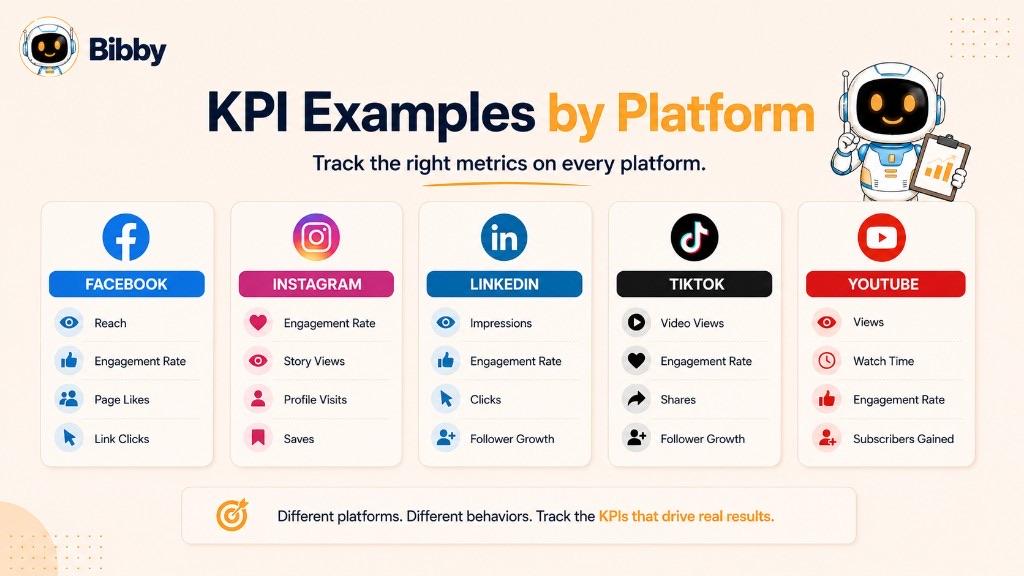
The right social media KPI can vary by platform because each network has different content formats, audiences, and ways of measuring performance. A KPI that matters on Instagram may not carry the same importance on LinkedIn or YouTube. Start with your objective, then select the platform-specific measurements that best indicate progress toward it.
Facebook KPIs
Common Facebook KPIs include reach, engagement rate, link clicks, video views, and follower growth. A brand focused on awareness may prioritize reach, while a lead-generation campaign may care more about clicks and conversions.
Instagram KPIs
Instagram indicators for visual and short-form content include reach, engagement rate, saves, shares, profile visits, link clicks, follower growth, and video views. Saves and shares can be particularly useful for understanding whether content provides enough value for people to keep or distribute.
LinkedIn KPIs
For professional and B2B-focused content, common LinkedIn KPIs include impressions, engagement rate, CTR, follower growth, website traffic, and leads generated. If the objective is pipeline generation, qualified leads or conversions may provide a much stronger indication of success than engagement alone.
TikTok KPIs
For short-form video campaigns on TikTok, useful KPIs can include video views, average watch time, video completion rate, engagement rate, shares, and follower growth. Watch time and completion rate can provide more context than raw views.
YouTube KPIs
Common YouTube KPIs include views, watch time, average view duration, CTR, subscriber growth, and engagement. For a channel focused on long-form content, watch time and average view duration may be more informative than simply counting views.
How to Choose Platform KPIs
Don't choose a KPI simply because a platform makes the number easy to find.
Instead, ask:
- What is the objective?
- What action do I want the audience to take?
- Which measurement best represents that action?
- What target would indicate success?
For example:
Goal: Generate leads Platform: LinkedIn KPI: Qualified leads generated Target: 100 qualified leads in 30 days
This keeps your reporting focused on outcomes rather than creating a report full of disconnected social media numbers.
How to Choose the Right KPI
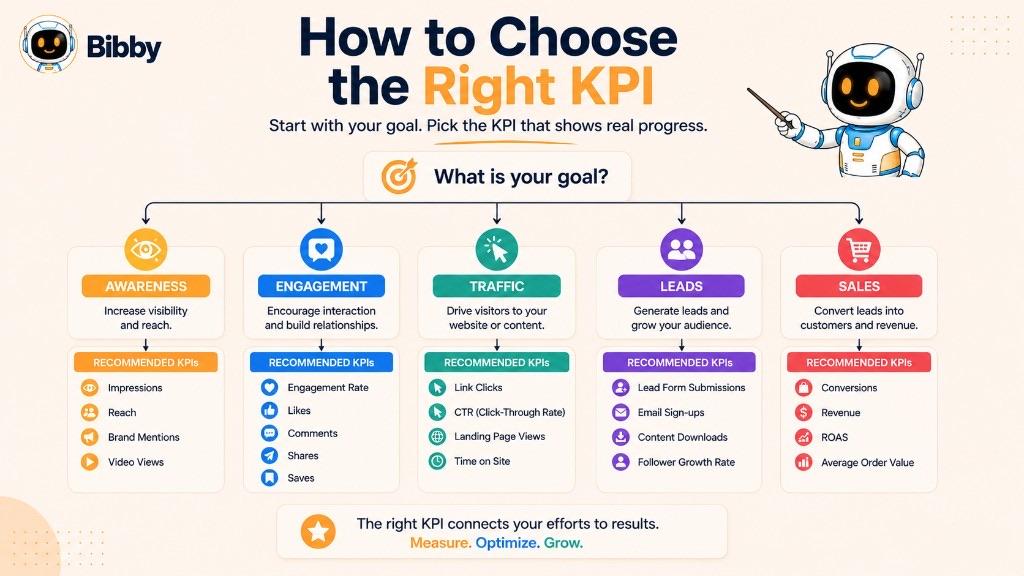
Choosing a KPI starts with your goal, not with the metrics available inside a social media analytics dashboard.
A good KPI should tell you whether your strategy is moving toward a meaningful outcome.
1. Define the business goal
Start with the result your business wants to achieve—increase sales, generate more qualified leads, increase brand awareness, retain more customers, or grow a relevant audience. A vague goal makes it difficult to select a meaningful KPI.
2. Define the social media objective
Determine how social media will contribute. For example:
Business goal: Increase product sales
Social media objective: Drive qualified visitors to the product page
3. Select the most relevant measurement
Choose the metric that most directly indicates whether you're achieving the objective—link clicks, CTR, product-page visits, conversion rate, or social-attributed purchases. The best choice depends on which part of the customer journey you are responsible for measuring.
4. Set a measurable target
Instead of “increase website traffic,” set a target such as: generate 10,000 qualified social-media visitors in 30 days. Now you can compare actual performance against a defined benchmark.
5. Set a timeframe
Evaluate every KPI over a meaningful period—7 days, 30 days, one quarter, or campaign duration—depending on the objective and how quickly meaningful results can occur.
6. Review and adjust
A KPI isn't useful if you collect it and never act on what it tells you. If performance is below target, investigate content, audience, offer, creative, distribution, landing page, or conversion process.
You can summarize the process as:
Goal → Objective → KPI → Target → Timeframe → Result → Action
For example: generate more leads → increase qualified traffic from LinkedIn → qualified leads generated → 200 leads → 30 days → 165 leads → analyze the campaign and improve the content or conversion path.
The right KPI gives you a measurement. The right target gives that measurement meaning.
What Makes a Good KPI?
A good KPI does more than produce a number. It gives you useful information about whether you are moving toward an important objective and helps you decide what to do next.
Relevant to a meaningful goal
If your goal is to generate leads, qualified leads generated is likely to be more useful than simply tracking follower count.
Measurable
You need a reliable way to collect and compare the data. A KPI that cannot be consistently measured is difficult to use for performance analysis.
Specific
“Improve social media” is not measurable enough. “Increase Instagram engagement rate from 3% to 5%” is much more specific.
Time-bound
A timeframe gives the KPI context: generate 500 website visits from social media within 30 days.
Actionable
A useful KPI should provide information that can influence a decision. If engagement rate falls significantly, you might investigate topics, formats, posting frequency, audience targeting, or creative approach.
Clearly defined
Everyone using the KPI should understand exactly what it measures and how it is calculated—especially when multiple teams, platforms, or reporting tools are involved.
Consistently tracked
Track it using consistent definitions and time periods so that changes in performance are meaningful.
A practical KPI checklist
Before adopting a KPI, ask:
- Does it connect directly to an important goal?
- Can it be measured reliably?
- Is the measurement clearly defined?
- Does it have a target?
- Does it have a timeframe?
- Can the result influence a decision?
If the answer is yes to most of these questions, you are likely dealing with a useful KPI rather than a number that is simply interesting to track.
KPI vs. Vanity Metric
A vanity metric is a number that may look impressive but does not necessarily tell you whether you are achieving an important business objective.
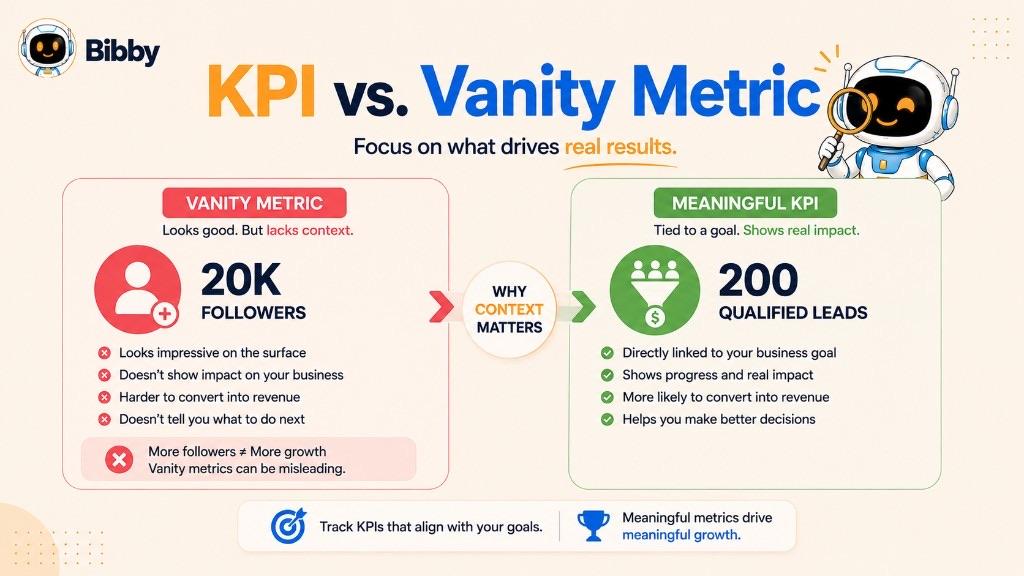
This doesn't mean vanity metrics are always useless. A large follower count, high number of views, or thousands of likes can provide context. The problem occurs when these numbers are treated as proof of success without considering what they actually contribute to the goal.
Imagine a company gains 20,000 new followers during a campaign whose actual objective was qualified leads, and those followers produced only 10 leads. Follower growth may be interesting, but it is not necessarily the most useful KPI. A better KPI might be qualified leads generated from social media.
| Potential vanity metric | More meaningful KPI |
|---|---|
| Total followers | Qualified follower growth |
| Likes | Engagement rate |
| Video views | Watch time or completion rate |
| Impressions | Qualified reach |
| Link clicks | Conversion rate |
| Website visits | Leads or purchases |
The right-hand measurement isn't automatically better in every situation. It becomes more useful when it is directly connected to the objective being measured.
Vanity metrics can create a false sense of success because they often measure attention rather than outcomes. Ten thousand video views sound impressive, but if the goal is sales you may also need clicks, visits, conversions, and revenue.
Don't ask only, “Did this number increase?” Ask, “Does this number tell us whether we're closer to our goal?”
How Are KPIs Measured?
KPIs are measured by collecting the data relevant to a specific objective and comparing the result against a defined target, previous performance, or benchmark. Some KPIs are simple counts; others are ratios or percentages.
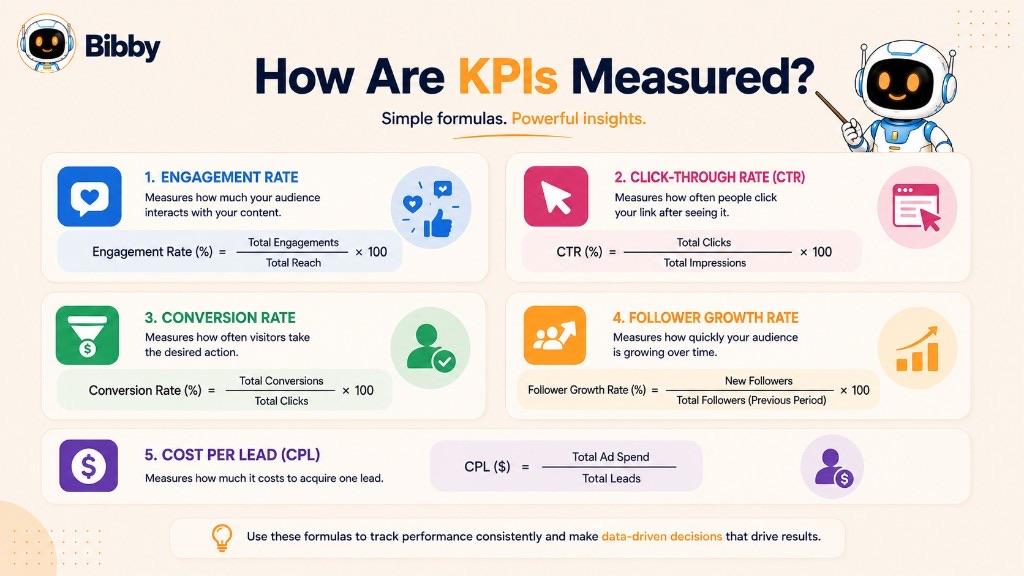
Engagement Rate
Engagement Rate = Total Engagements ÷ Reach × 100
Depending on the platform, engagement rate may instead use impressions, followers, or another denominator. Always check how the platform defines the metric before comparing results.
Click-Through Rate (CTR)
CTR = Clicks ÷ Impressions × 100
If a post receives 10,000 impressions and 300 clicks: 300 ÷ 10,000 × 100 = 3% CTR.
Conversion Rate
Conversion Rate = Conversions ÷ Total Visitors or Clicks × 100
If 1,000 people visit a landing page and 50 complete a form: 50 ÷ 1,000 × 100 = 5% conversion rate.
Follower Growth Rate
Follower Growth Rate = New Followers ÷ Starting Followers × 100
If an account starts the month with 10,000 followers and gains 500: 500 ÷ 10,000 × 100 = 5% growth.
Cost Per Lead
For paid campaigns: Cost Per Lead = Total Campaign Spend ÷ Number of Leads. If a campaign spends $2,000 and generates 100 leads: $20 per lead. Related paid metrics include CPC and CPM.
Why measurement definitions matter
There is no single formula that applies to every KPI, and different platforms may define similar metrics differently. Before comparing performance, know what the KPI measures, how it is calculated, what data is included, what timeframe is being used, and whether the definition has changed.
How to Track Social Media KPIs
Tracking social media KPIs means consistently collecting the performance data connected to your objectives, comparing it against your targets, and using the results to guide decisions.
1. Use native platform analytics
Most major social networks provide their own analytics and reporting tools. Depending on the platform, you may monitor reach and impressions, engagement, video performance, clicks, audience growth, website activity, and conversions. Native analytics are useful when you need detailed information about a specific platform—and they remain the source of truth for those numbers.
2. Compare across channels carefully
If you manage multiple social networks, you may also use dedicated reporting tools to bring performance information together. When comparing platforms, remember that the same metric may be defined differently across networks.
3. Track KPIs against targets
Simply recording a KPI isn't enough. Compare the current result with the target you established.
| KPI | Target | Actual | Status |
|---|---|---|---|
| Engagement rate | 5% | 6.2% | Above target |
| Website clicks | 5,000 | 4,200 | Below target |
| Qualified leads | 200 | 235 | Above target |
This makes reporting more useful because you can immediately see where performance is exceeding or falling short of expectations.
4. Monitor trends, not isolated results
A single day's performance rarely tells the whole story. Look week over week, month over month, campaign over campaign, and year over year. Trend analysis can reveal whether a change is temporary or part of a larger pattern.
5. Connect social KPIs to business outcomes
The strongest KPI tracking goes beyond platform-level numbers:
Social post → Website visit → Lead → Customer → Revenue
When possible, connect social media activity to downstream outcomes so you can understand not only how content performed, but also what business impact it produced.
Publishing consistently while you measure
For teams managing multiple social channels, consistent publishing can become difficult when every platform requires a separate workflow. Bibby brings social media creation and scheduling into one place: create content, generate captions, schedule posts across Facebook, Instagram, LinkedIn, YouTube, and TikTok, and manage tasks through chat.
The goal isn't to track every number available in a product dashboard. It's to make sure the KPIs you choose remain connected to the objectives you're trying to achieve—and that you can publish consistently enough for those measurements to mean something.
Why Are KPIs Important in Social Media Marketing?
Without KPIs, it is easy to spend time creating and publishing content without knowing whether that activity is contributing to the results the business actually wants.
KPIs show whether your strategy is working. If the objective is qualified website traffic, tracking CTR and social-sourced visitors can show whether your content is generating the desired response.
KPIs connect social media to business goals—leads, sales, revenue, website traffic, customer acquisition, and brand awareness—beyond surface-level engagement.
KPIs help identify what is working. You might discover that short-form videos generate higher engagement, educational posts produce more saves, certain topics drive more website traffic, a particular platform generates more qualified leads, or some campaigns consistently outperform others.
KPIs support better decisions: Should we create more content like this? Is this campaign worth continuing? Which platform deserves more attention? Are we reaching the right audience? Is social media generating meaningful business results?
KPIs make performance easier to communicate. Instead of presenting dozens of disconnected numbers, show the few measurements that matter most, compare them with their targets, and explain what the results mean.
Ultimately, KPIs turn social media performance from a collection of numbers into a measurable feedback loop: set a goal, publish and test content, measure the result, learn from the data, and improve the next round of activity.
KPI Example: Measuring a Social Media Campaign
Imagine a software company launching a new product and using social media to generate qualified leads. Instead of measuring success only through likes or impressions, the team defines its objective first.
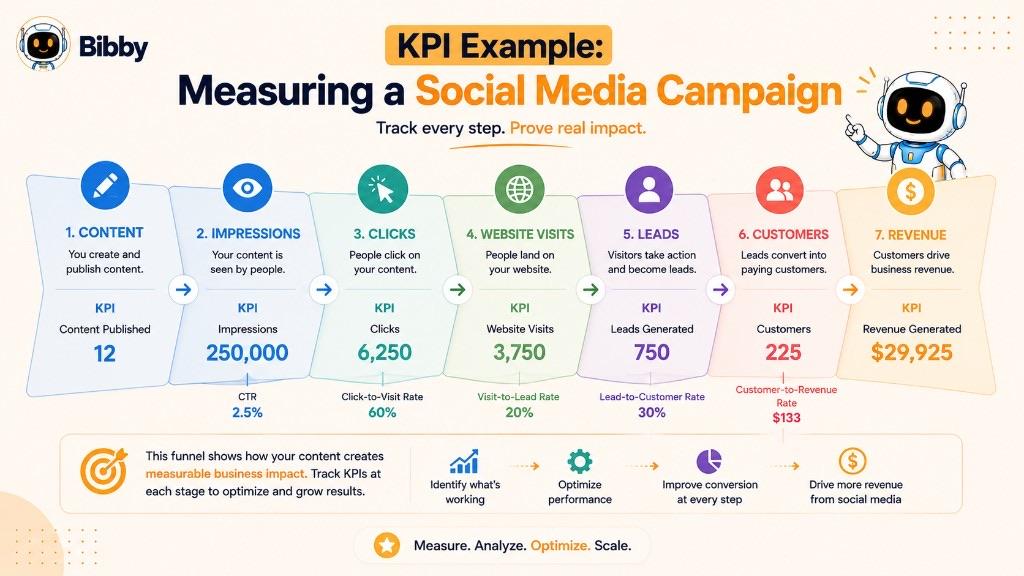
Campaign goal: Generate qualified leads for the new product.
Social media objective: Drive relevant users from social media to a product landing page and convert them into leads.
Selected KPIs: Qualified leads generated (primary outcome), CTR (how effectively content drives clicks), landing-page conversion rate, and cost per lead if the campaign is paid.
| KPI | Target | Actual |
|---|---|---|
| Qualified leads | 200 | 165 |
| CTR | 3% | 3.8% |
| Landing-page conversion rate | 5% | 3.4% |
| Cost per lead | $20 | $24 |
The CTR exceeded the target, which suggests the social content was effective at generating interest. The landing-page conversion rate was below target, and the campaign generated fewer qualified leads than expected.
If people are clicking at a healthy rate but aren't converting after reaching the landing page, investigate the landing-page experience, the offer, messaging match between the post and page, the call to action, page load speed, and the form or signup process.
The team might conclude: social content is generating interest, but the conversion path needs improvement. That insight leads to a specific action rather than simply labeling the campaign a success or failure.
Social content → Clicks → Landing-page visits → Leads → Customers
Each stage can have supporting metrics, but keep the primary KPI connected to the outcome that matters most. In this example, qualified leads are the primary KPI, while CTR and landing-page conversion rate help explain why the campaign is or isn't reaching that goal.
What Is a KPI Dashboard?
A KPI dashboard is a centralized view of the measurements used to monitor progress toward important goals. Instead of searching through multiple reports or platforms, a dashboard brings key performance information together so you can quickly see what is happening, compare results with targets, and identify areas that need attention.
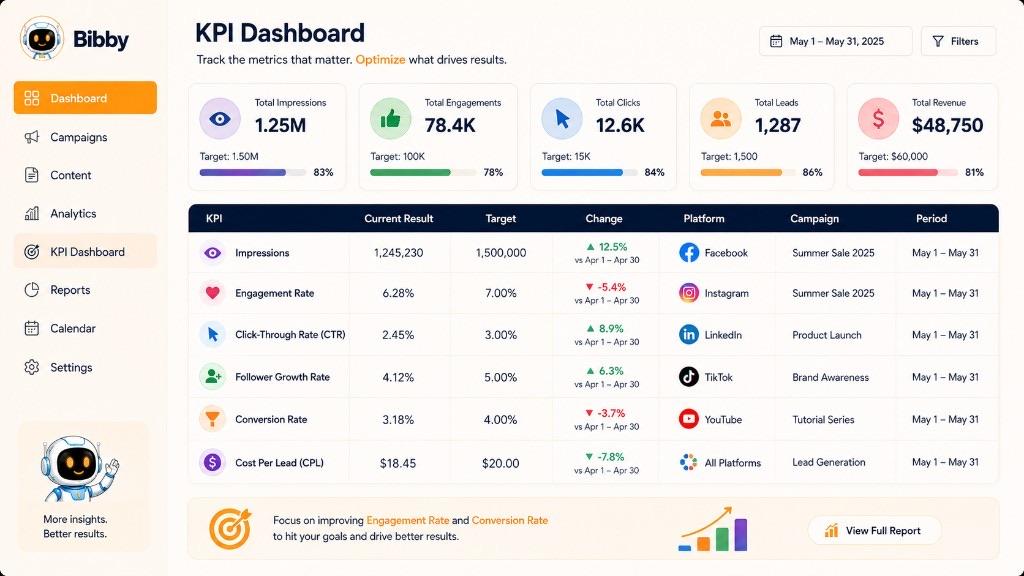
For social media, a KPI dashboard might include:
| KPI | Current result | Target | Change |
|---|---|---|---|
| Engagement rate | 5.8% | 5% | +0.8% |
| Website clicks | 4,350 | 5,000 | -650 |
| Qualified leads | 218 | 200 | +18 |
| Follower growth | 4.2% | 3% | +1.2% |
The exact KPIs should depend on the objectives being measured. A brand-awareness campaign might emphasize reach and qualified impressions, while a lead-generation campaign might focus on qualified leads, conversion rate, and cost per lead.
A useful dashboard typically shows the KPI, current value, target, previous result, percentage change, time period, and platform or campaign. A common mistake is filling it with every metric available. Prioritize the KPIs that answer the most important questions; use supporting metrics to explain why a KPI is performing the way it is.
Primary KPI: Qualified leads
Supporting metrics: CTR, landing-page visits, conversion rate
A KPI dashboard should help someone answer three questions quickly:
- Are we on track?
- What is driving the result?
- What should we do next?
Build that view from native platform analytics and any other tracking you already use. Bibby is for creating and scheduling the content that feeds those results—not a replacement for platform reporting.
Common KPI Mistakes to Avoid
Tracking too many KPIs
When everything is treated as important, it becomes difficult to identify what actually matters. Choose a focused set of primary KPIs and use supporting metrics to explain their performance.
Choosing KPIs before defining the goal
Starting with a favorite metric and then trying to justify it as a KPI reverses the process. Define the goal first, then select the measurement that best represents progress toward it.
Treating every metric as a KPI
Likes, impressions, clicks, followers, and views can all provide useful information. Ask whether the metric directly helps you evaluate an important objective.
Focusing only on vanity metrics
Millions of impressions may indicate strong exposure, but they don't necessarily mean the campaign generated customers. Connect measurements to outcomes such as qualified leads, conversions, or revenue.
Ignoring the target
Knowing that your engagement rate is 4% doesn't tell you whether that is good or bad by itself. Compare against a target, historical performance, or a relevant benchmark.
Comparing incompatible metrics
Different platforms can define similar metrics differently. Understand how each platform defines a KPI before comparing results across channels.
Looking at isolated results
Seasonality, campaigns, content formats, platform changes, and external events can all influence performance. Review KPI trends over appropriate periods.
Changing definitions midway through a campaign
If the way a KPI is calculated changes during a reporting period, your before-and-after comparison may no longer be reliable. Document how each KPI is defined and keep the methodology consistent whenever possible.
Measuring without taking action
If a KPI consistently falls below its target, investigate what is causing the problem and determine what should change. The best KPI reporting doesn't stop at “what happened?” It leads to “why did it happen?” and “what should we do next?”
Track Your Social Media Performance With Bibby
Knowing which KPIs matter is only the first step. You also need a consistent way to create, publish, and manage the social media content that influences those results.
Bibby brings social media creation, scheduling, and automation into one workflow. You can upload your own images or generate visuals with AI, choose a posting style, and let Bibby generate captions and schedule your content at AI-optimized times across Facebook, Instagram, LinkedIn, YouTube, and TikTok.
You can also publish images, carousels, videos, and Stories. Bibby's chat interface lets you manage tasks such as creating a brand kit, building a campaign, creating posts, regenerating captions, and organizing content.
The goal is not to replace your KPIs with another dashboard of numbers. It's to make the execution behind your strategy easier and more consistent, so you can spend more time reviewing native analytics and improving the content that supports your goals.
Key Takeaways
A KPI is a measurable value chosen because it shows progress toward an important objective. Every KPI is a metric; not every metric is a KPI.
- Choose the KPI after you define the goal.
- Match measurements to outcomes: awareness, engagement, traffic, leads, sales, audience growth, or support.
- Set a target and a timeframe.
- Don't treat vanity metrics as proof of success.
- Compare like with like—platform definitions differ.
- Use supporting metrics to explain the primary KPI, then act on what you learn.
With Bibby, you can create images, carousels, videos, and Stories, generate captions, and schedule posts across Facebook, Instagram, LinkedIn, YouTube, and TikTok—then review KPI counts in each platform's analytics.
Continue learning with related dictionary entries on reach, impressions, engagement rate, CTR, conversion rate, ROI, and followers—or browse the social media dictionary. Then start a free Bibby trial to create, caption, and schedule content across your channels.