
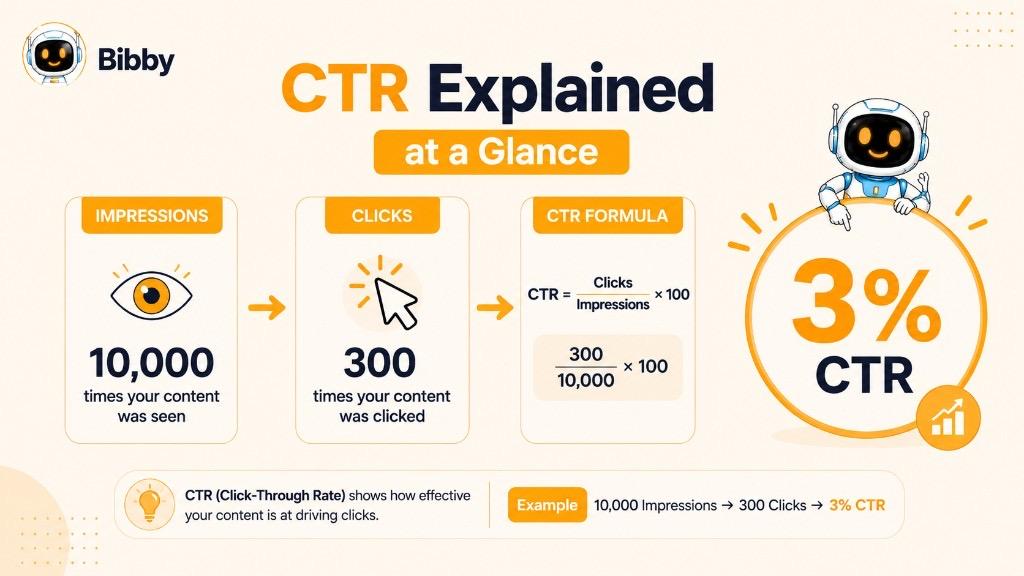
CTR (Click-Through Rate) is a digital marketing metric that tells you how many people clicked on a link, ad, post, or call-to-action after seeing it. In simple terms, CTR helps you understand whether your content gives people enough reason to stop scrolling and take the next step.
For example, if 1,000 people see your social media post and 50 click the link, your CTR is 5%.
CTR is used across social media, search engines, online advertising, email marketing, and websites to measure how effectively content turns visibility into clicks. A higher CTR can indicate that your headline, visual, offer, or call-to-action is relevant and compelling. However, CTR is only one part of the marketing funnel. A post can generate plenty of clicks but still produce few leads or sales if the landing page or offer does not deliver what users expected.
For social media marketers, CTR becomes especially useful when comparing different captions, creatives, posting formats, audiences, platforms, and publishing times. Tracking these patterns helps you understand what makes your audience move from seeing your content to actually engaging with it.
With AI-powered tools such as Bibby, marketers can create content, generate captions, test posting styles, and schedule posts across platforms at AI-optimized times. The goal is not simply to chase a higher CTR, but to consistently attract the right clicks from the right audience.
What Does CTR Stand For?
CTR stands for Click-Through Rate. It is a percentage-based metric that measures how often people click a link, advertisement, post, button, or other clickable element after seeing it.
Click
Through
Rate
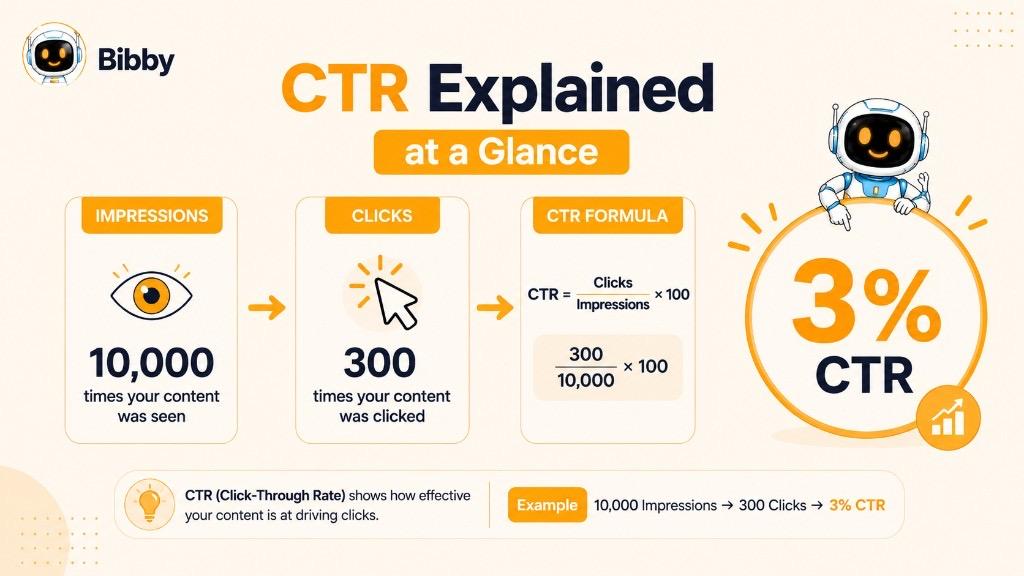
A higher CTR generally means a larger proportion of people who saw the content decided to click. A lower CTR may indicate that the content, visual, headline, CTA, audience, or offer needs improvement.
CTR is commonly used in:
- Social media marketing to measure clicks from posts and ads
- Search advertising to measure clicks on paid search results
- SEO to measure clicks from organic search results
- Email marketing to measure clicks on links within emails
- Display advertising to measure responses to banner ads
- Landing pages and websites to evaluate clickable elements and CTAs
It is important to remember that CTR measures clicks, not conversions. A strong CTR can bring more visitors to your website, but those visitors still need to complete the desired action. Evaluate CTR alongside conversion rate, engagement rate, CPC, and revenue.
How Does Click-Through Rate Work?
Click-Through Rate works by comparing the number of clicks your content receives with the number of times it was shown. The result is a percentage that shows how effectively visibility turns into action.
Content is shown → User sees it → User clicks → Click is recorded → CTR is calculated
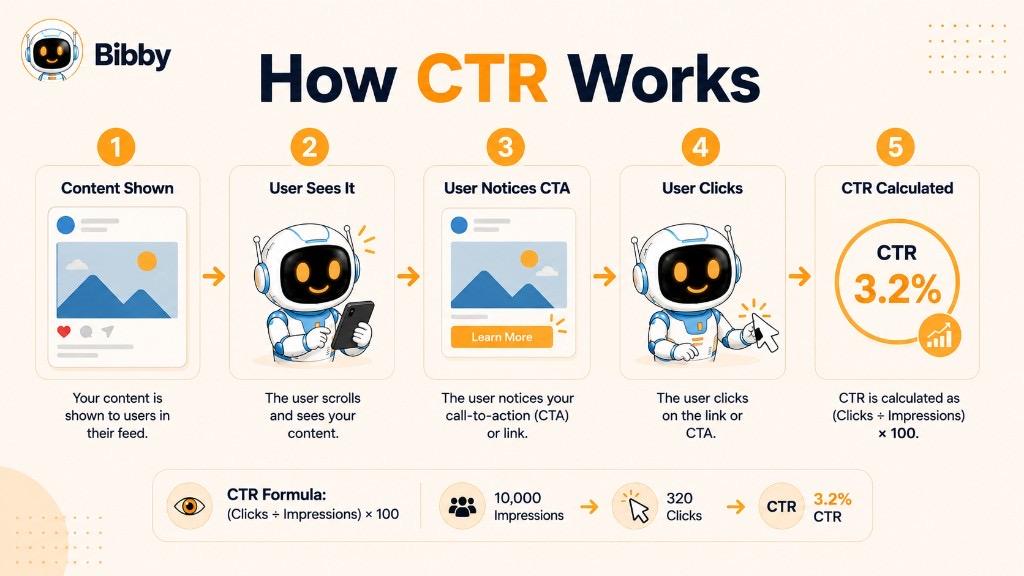
For example, a social media post with 8,000 impressions and 240 clicks has:
CTR = (240 ÷ 8,000) × 100 = 3%
That means 3% of the measured impressions resulted in a click.
What Happens When Someone Clicks?
When a user sees your content, they might scroll past it, like or comment, or click the link or CTA. When they click, the platform records that action. CTR then puts those clicks into context against impressions.
| Metric | Result |
|---|---|
| Impressions | 10,000 |
| Clicks | 400 |
| CTR | 4% |
The 4% CTR tells you the content generated 400 clicks from 10,000 measured impressions.
Why Is CTR Useful?
If two posts receive similar impressions but one generates significantly more clicks, the higher-CTR post may have a stronger hook, visual, caption, call-to-action, offer, audience match, or format.
CTR should not be viewed in isolation. A high CTR tells you that people are clicking, not whether those clicks became leads, purchases, sign-ups, or other conversions.
How to Calculate CTR
Calculating CTR is straightforward. You only need two numbers: clicks and impressions.
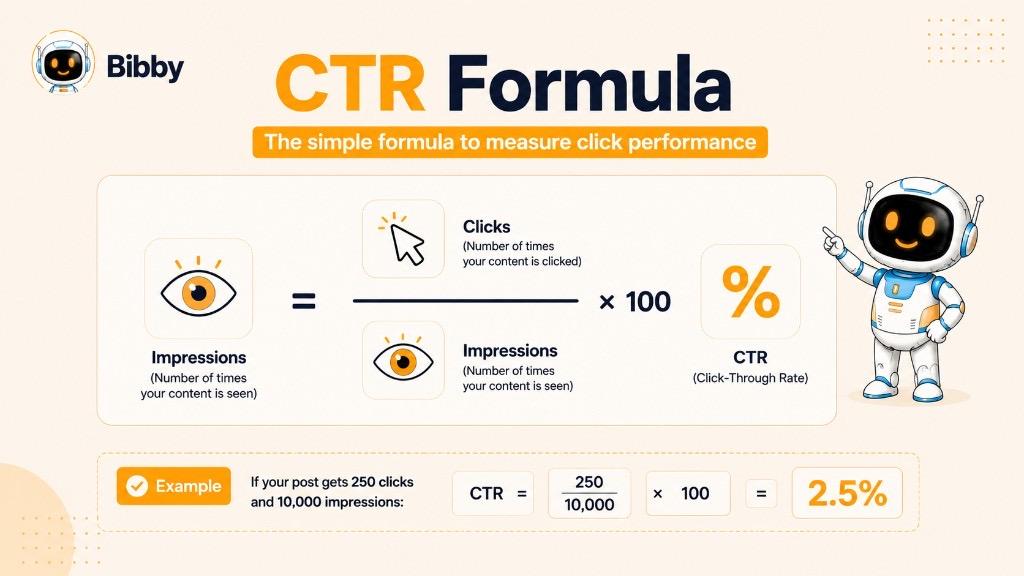
Understanding the CTR Formula
Number of Clicks: how many times users clicked the link, button, advertisement, or other tracked element.
Number of Impressions: how many times the content was displayed. The exact definition can vary by platform.
× 100: converts the ratio into a percentage.
More CTR Examples
Social media: 20,000 impressions and 600 clicks = 3% CTR
Online advertisement: 50,000 impressions and 1,250 clicks = 2.5% CTR
Email campaign: 10,000 delivered emails and 400 clicks = 4% CTR (depending on the platform's denominator)
The calculation is simple, but clicks and impressions can be defined differently across platforms. Always check the reporting methodology before comparing CTR from different channels.
Why CTR Calculation Matters
CTR gives context that raw click counts cannot.
- Post A: 500 clicks from 100,000 impressions = 0.5% CTR
- Post B: 300 clicks from 10,000 impressions = 3% CTR
Post A generated more total clicks, but Post B was much more effective at turning impressions into clicks. That is why CTR is useful when comparing posts, ads, campaigns, captions, creatives, and CTAs.
CTR in Social Media
CTR in social media measures how often users click a link or other tracked call-to-action after seeing your content. It helps you understand whether a post, advertisement, Story, video, or other social content is moving people beyond passive viewing.
Example: a LinkedIn post promoting a blog article receives 15,000 impressions and 450 link clicks.
CTR = (450 ÷ 15,000) × 100 = 3%
What Can Users Click on Social Media?
Depending on the platform and format, users may click website or blog links, product pages, landing pages, lead-generation forms, app downloads, shopping links, profile links, campaign CTAs, or other tracked destinations.
Why CTR Matters on Social Media
Social feeds are crowded. CTR is one way to determine whether your content gives users a reason to click—through attention-grabbing visuals, relevant messaging, strong captions, a clear CTA, a useful offer, audience relevance, and an effective format.
A carousel that explains a problem and ends with “Read the Complete Guide” may generate more clicks than a generic promotional post because it gives the audience a clear next step.
CTR Across Platforms
CTR can be relevant on Facebook, Instagram, LinkedIn, TikTok, and YouTube, but the click metric and calculation can vary by platform, placement, and campaign type.
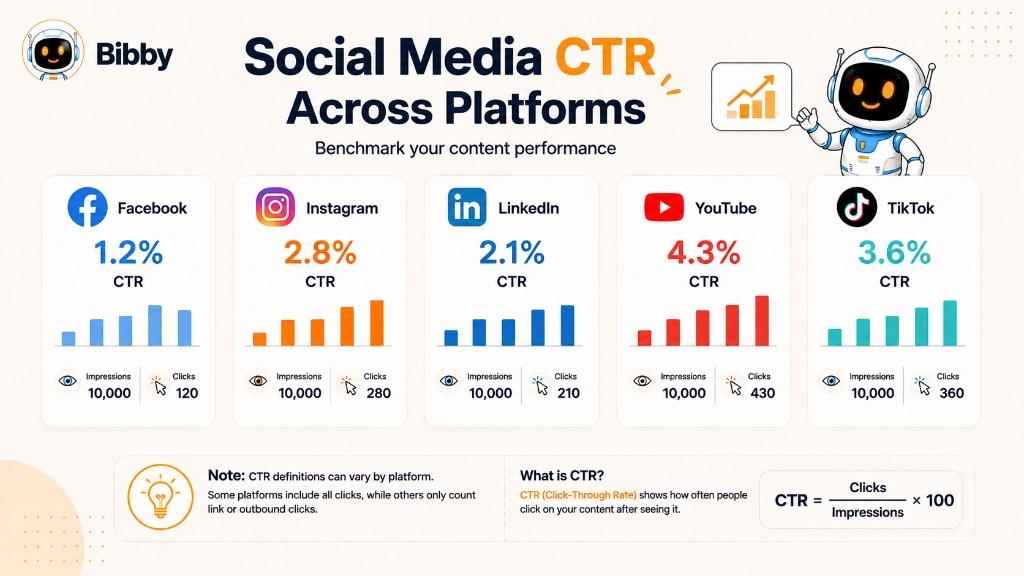
- Facebook: useful for link-focused posts and ads
- Instagram: eligible links, Stories, ads, and other click destinations
- LinkedIn: sponsored content and traffic-focused posts
- TikTok: traffic-oriented advertising and campaigns
- YouTube: thumbnail CTR (clicks on a video after seeing the thumbnail) is different from a website-link CTR
Avoid comparing numbers from different platforms without checking what each CTR represents.
CTR Is Not the Same as Engagement Rate
A user can like, comment, share, save, watch, or follow without clicking a link. CTR focuses on click behavior, while engagement rate covers a broader range of interactions. CTR is especially valuable when the goal is traffic, leads, product promotion, or a specific destination.
What Does CTR Mean for Social Media Marketing?
In social media marketing, CTR shows how effectively your content turns attention into clicks. Impressions tell you how many times content was displayed; CTR tells you how often users took the next step.
What Does a High CTR Mean?
A relatively high CTR can indicate that your hook, caption, visual, CTA, offer, audience targeting, and format are working together.
Post A: 20,000 impressions and 200 clicks = 1% CTR
Post B: 20,000 impressions and 600 clicks = 3% CTR
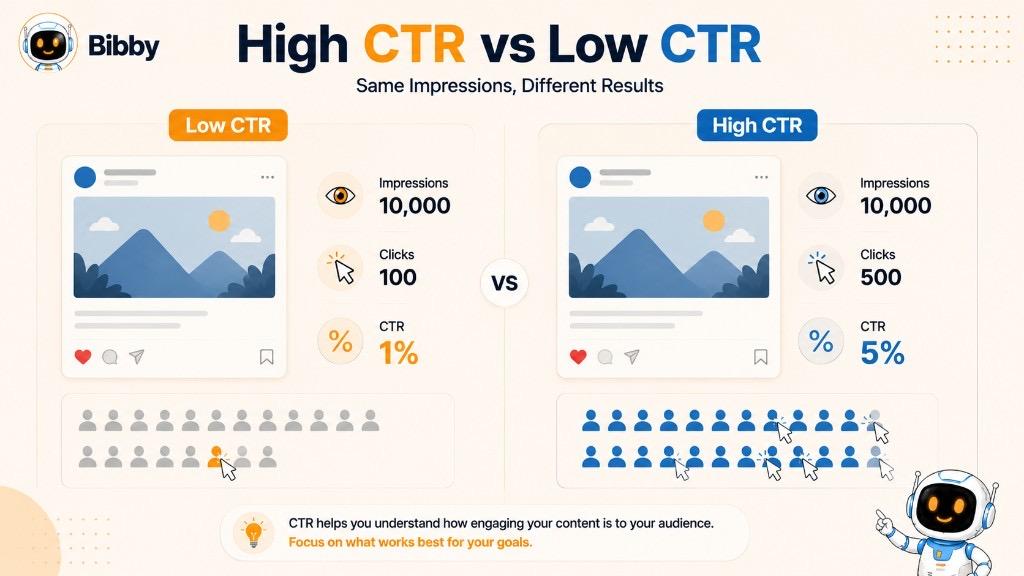
Post B generated three times as many clicks from the same impressions. A high CTR still does not automatically mean a successful campaign if those clicks do not become leads, sales, or registrations.
What Does a Low CTR Mean?
A low CTR can mean users are seeing the content but lack motivation to click—weak hook, unclear CTA, irrelevant audience, weak visual, weak offer, wrong format, or an unclear landing-page promise. A low CTR is a diagnostic signal, not automatically a failure.
Why CTR Matters for Different Goals
If the goal is brand awareness, impressions, reach, video views, and engagement may matter more than clicks.
If the goal is website traffic, CTR becomes much more important.
If the goal is lead generation or ecommerce, CTR is the first step—conversion rate, cost per lead, and purchases still decide success.
Impression → Click → Website Visit → Conversion → Revenue
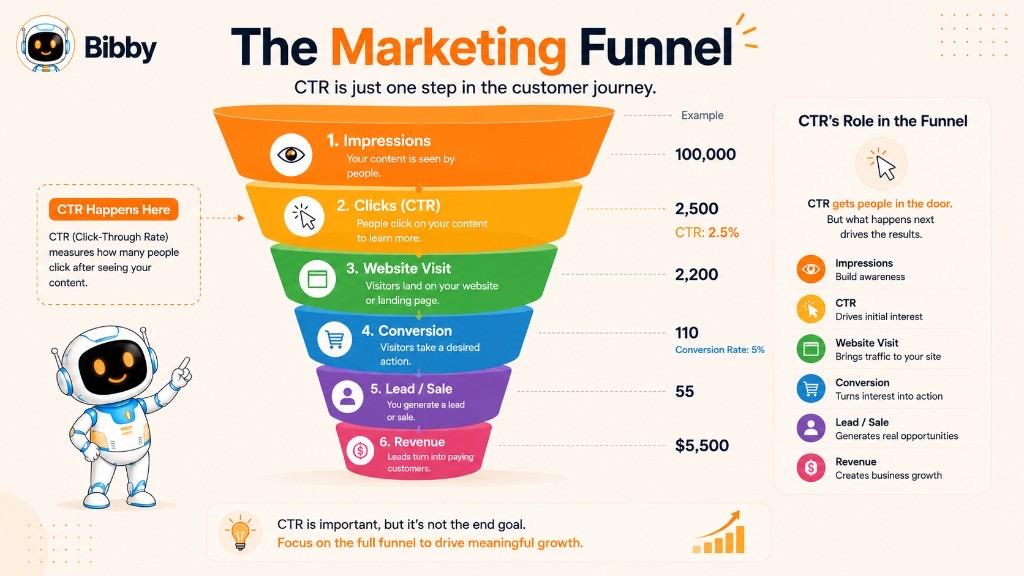
CTR primarily measures the transition from impression to click.
Should You Always Try to Increase CTR?
Not necessarily. Optimizing for clicks alone can encourage clickbait. A sensational headline may produce a high CTR but disappoint visitors.
“You won't believe what happens next!”
might generate curiosity clicks.
“See 7 AI strategies you can use to automate your social media”
sets a clearer expectation and attracts people who actually want the information.
Evaluate CTR With Other Metrics
Track CTR alongside:
- Impressions for visibility
- Reach for unique audience exposure
- Engagement rate for broader interaction
- CPC for the cost of clicks in paid campaigns
- Conversion rate for actions after the click
- Cost per conversion and revenue for business impact
The best CTR is not necessarily the highest number. It is the CTR that generates valuable traffic from the right audience.
What Is a Good CTR?
There is no single CTR that is good for every campaign, platform, or industry. A 2% CTR could be strong in one campaign and weak in another. Compare CTR against relevant benchmarks and your own historical performance.
What Factors Determine a Good CTR?
Platform, campaign objective, industry, content format, audience, placement, device, creative, and CTA all influence what “good” looks like. Facebook, Instagram, LinkedIn, and TikTok have different user behaviors and measurement systems.
How Should You Judge Your CTR?
Ask: “Is my CTR improving compared with similar content and campaigns?”
If your last 10 comparable posts averaged 1.8% CTR and a new post hits 3.2% with a similar audience and objective, that improvement is more meaningful than an arbitrary industry number.
Is a Higher CTR Always Better?
No.
| Campaign | CTR | Conversion Rate |
|---|---|---|
| Campaign A | 6% | 1% |
| Campaign B | 3% | 8% |
Campaign A generates more clicks, but Campaign B converts a much larger share of visitors. If the goal is customers or leads, Campaign B can deliver better business results.
Compare CTR with previous campaigns, the same format, the same platform, the same audience, the same objective, similar time periods, and relevant industry benchmarks.
Focus on qualified clicks, not just more clicks. The post, CTA, and landing page should deliver the same promise.
What Is a Low CTR?
A low CTR means a relatively small percentage of people who saw your content clicked. It can signal weak interest or the wrong audience—but it does not automatically mean the content failed. Always read CTR in context.
What Can Cause a Low CTR?
- Weak hook or headline
- Unclear call-to-action
- Irrelevant content or the wrong audience
- Poor visuals
- Content fatigue from repeating similar creative
- Poor timing
- A weak offer with no obvious reason to click
How Do You Diagnose a Low CTR?
Ask whether impressions or reach changed, whether the audience is relevant, whether the creative is repetitive, whether the hook and CTA are clear, whether the offer is compelling, whether the format fits the platform, whether timing is effective, and whether CTR declined versus similar previous content.
How Can You Improve a Low CTR?
Test one major variable at a time: a stronger hook, different headlines, more relevant visuals, clearer CTAs, different formats, tighter targeting, alternative offers, new captions, or different posting times.
Do not chase CTR with exaggerated headlines. The journey is:
Attention → Interest → Click → Experience → Conversion
CTR tells you what happens at the click stage. The rest of the journey determines business value.
Factors That Affect CTR
CTR is influenced by creative quality, caption, audience, CTA, format, and posting time—not just how many people see the content.
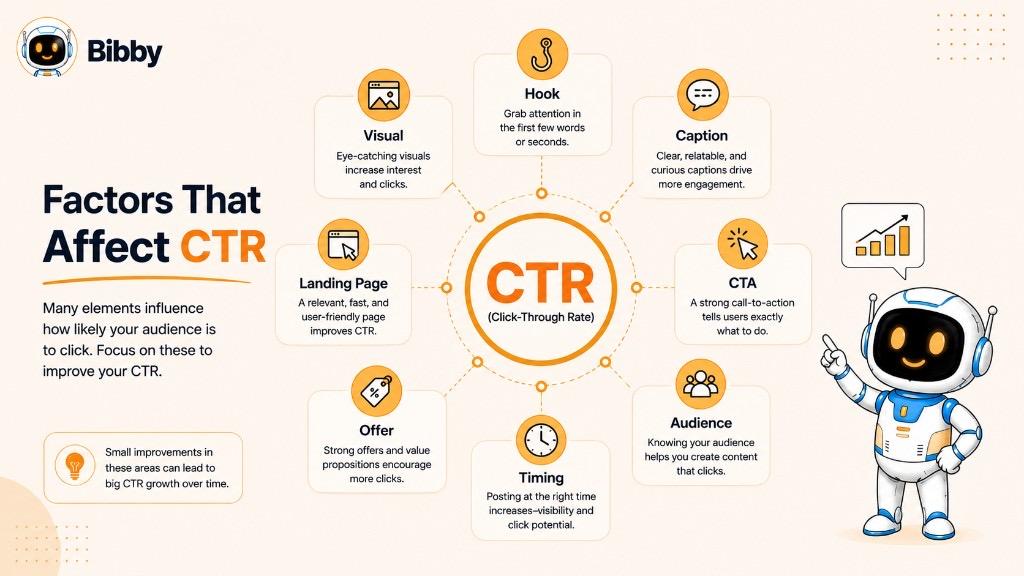
1. Content Relevance
People click content that matches their interests, needs, or problems. A post about social media automation is more likely to generate clicks among marketers and business owners looking to save time.
2. Hook or Headline
Weak: “Social media tips for businesses”
Stronger: “5 ways to automate your social media without posting manually every day”
The second example gives a clearer reason to continue.
3. Visual Quality
Clarity, layout, branding, text placement, and design all affect whether someone stops scrolling.
4. Call-to-Action
A CTA tells users what to do next—Read the full guide, Learn more, Get started, Download the report, Book a demo, Shop now, Watch the video, Try it free. A clear CTA removes uncertainty.
5. Audience Targeting
The right message can still produce a poor CTR if it reaches the wrong people. In paid social, audience targeting can significantly change click behavior.
6. Content Format
Single-image posts, carousels, short-form videos, Stories, text posts, ads, educational content, and promotional content can produce different click behavior. Compare formats with your own data.
7. Posting Time
Publishing when your audience is active can increase the chance of impressions and interaction. There is no universal best time to post—it depends on audience, platform, location, industry, and history.
8. Offer or Value Proposition
Instead of “Visit our website,” communicate value: “Get the free 2026 social media content calendar.”
9. Caption and Messaging
Strong captions address a problem, create curiosity, explain a benefit, provide useful information, and lead naturally toward the CTA.
10. Trust and Brand Recognition
People click more readily when they recognize and trust the source.
11. Landing Page Relevance
If the post promises a free guide and the landing page is a generic product page, you may get clicks without results.
12. Content Fatigue
If CTR declines while the same creative keeps running, refresh the visual, caption, hook, offer, CTA, or format—especially in paid campaigns.
Right Audience + Relevant Content + Strong Creative + Compelling Message + Clear CTA + Good Timing = Greater potential for clicks
How to Improve CTR
Improving CTR means giving the right audience a clear reason to click—from the first visual to the destination page.
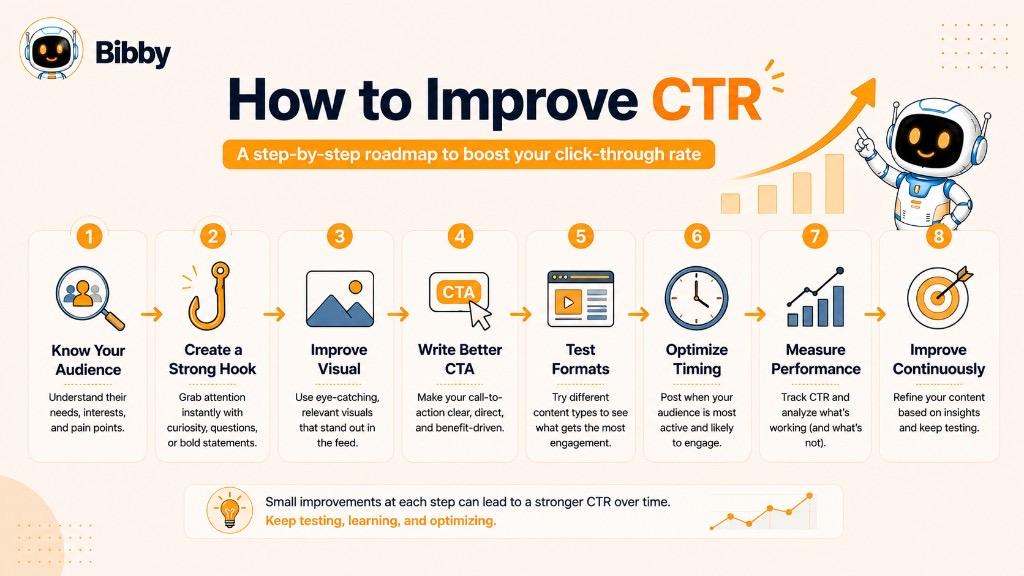
1. Create Stronger Hooks
Instead of “Here are some social media tips,” try “Still posting manually every day? Here are 7 ways to automate your social media workflow.”
2. Use Clear, Action-Oriented CTAs
Match the CTA to the destination: Read the full guide, Start your free trial, Download the checklist, See how it works, Get the complete report, Book a demo.
3. Make Visuals More Compelling
Test high-quality images, short-form video, carousels, strong typography, product demos, before-and-after visuals, and educational graphics. Avoid overcrowding.
4. Match Content to Your Audience
Ask what problem they have, what they are looking for, what motivates them, what might stop them from clicking, and what they get after the click.
5. Test Different Content Formats
Image → Carousel → Video → Story → Text-based post
Use performance data rather than assumptions.
6. Experiment With Captions
Test question-based, benefit-focused, educational, problem-solution, curiosity-driven, promotional, and storytelling captions.
7. Optimize Posting Times
Use your own data for days, times, platforms, and formats rather than generic charts. Best time to post varies by audience.
8. Test CTAs and Creative Versions
Compare “Learn More” with “See How AI Social Media Automation Works.” The second CTA communicates what users can expect.
9. Reduce the Gap Between Post and Landing Page
Social Post → Click → Relevant Landing Page → Desired Action
A high CTR followed by poor conversions often means the problem is after the click.
10. Use A/B Testing
A/B testing lets you compare headlines, images, captions, CTAs, offers, formats, or audiences. Change one major variable at a time.
11. Refresh Content When Performance Declines
Creative fatigue is common. Refresh the visual, hook, caption, CTA, offer, or format.
12. Use AI to Speed Up Testing
Bibby can help you upload or generate images, choose a posting style, generate and regenerate captions, create campaigns, and schedule posts across Facebook, Instagram, LinkedIn, YouTube, and TikTok.
Do not optimize for clicks alone:
Impressions → CTR → Clicks → Conversion Rate → Leads/Sales → Revenue
A slightly lower CTR with highly qualified traffic can be more valuable than a huge CTR with almost no conversions.
CTR and AI-Powered Social Media Automation
Click performance is influenced by creative, caption, CTA, format, audience, platform, and publishing time at once. AI can make it easier to create, test, publish, and refine those variables.
AI can suggest content angles, generate caption variations with different hooks, help repurpose ideas into images, carousels, videos, and Stories, and support scheduling at suitable times. Optimized timing is one factor, not a guarantee of higher CTR.
AI Automation → More Efficient Testing → Better Insights → Better Content Decisions → Potentially Better CTR
The key word is potentially. Always measure with campaign data.
Treat CTR as a feedback loop:
Create → Publish → Measure → Learn → Improve → Create Again
How Bibby Can Help You Optimize Social Media CTR
Bibby brings content creation, AI captions, campaign management, and scheduling into one workflow so you can test the variables that influence CTR.
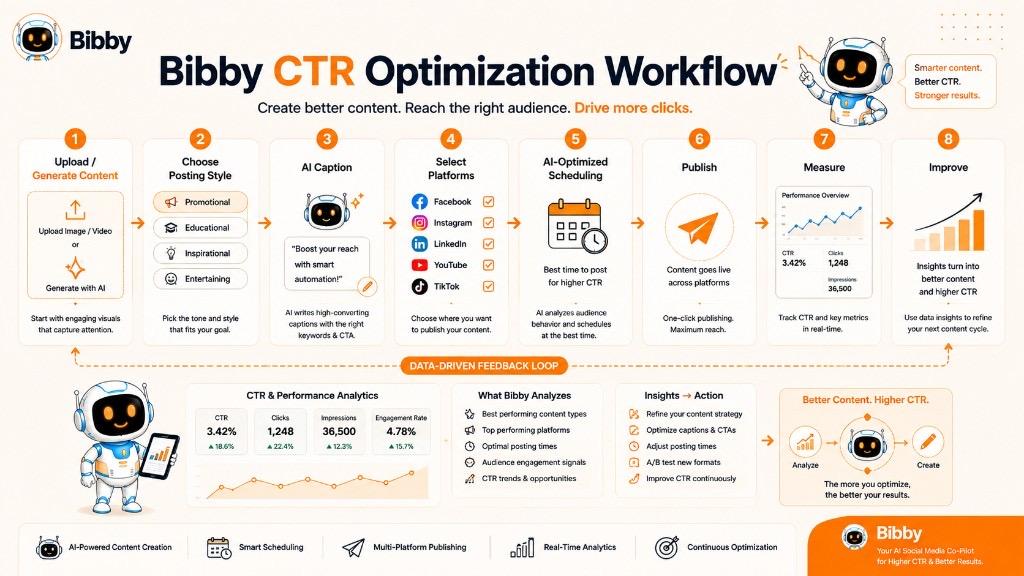
Step 1: Create or Upload Your Content
Upload an image or generate one with AI for different campaigns, topics, audiences, and platforms.
Step 2: Choose Your Posting Style
Select a posting style that matches your objective so the post has a structured starting point.
Step 3: Let AI Generate the Caption
Generate captions from your content and style, then regenerate when you want a different hook or message.
Step 4: Select Your Platforms
Publish across Facebook, Instagram, LinkedIn, YouTube, and TikTok as part of a broader cross-platform strategy.
Step 5: Schedule at AI-Optimized Times
Automate publishing windows while you test different times. Timing is only one CTR factor, but consistency matters.
Step 6: Create Different Content Formats
Test images, carousels, videos, and Stories—CTR is not limited to traditional link posts.
Step 7: Manage Social Media Through Chat
Use Bibby's chat interface to create a brand kit, campaigns, and posts, regenerate captions, and manage the workflow conversationally.
Step 8: Learn From Performance
Compare Content → Impressions → CTR → Clicks → Conversions across topics, visuals, captions, CTAs, platforms, formats, and times.
Create → Caption → Schedule → Publish → Measure → Learn → Improve
Bibby does not guarantee a specific CTR. Results still depend on audience, content quality, offer, platform, competition, and objective. The advantage is a faster way to create, test, and refine your strategy.
CTR vs Other Digital Marketing Metrics
A click is only one step in the customer journey. Evaluate CTR with conversion rate, engagement rate, impressions, reach, CPC, CPM, and revenue.
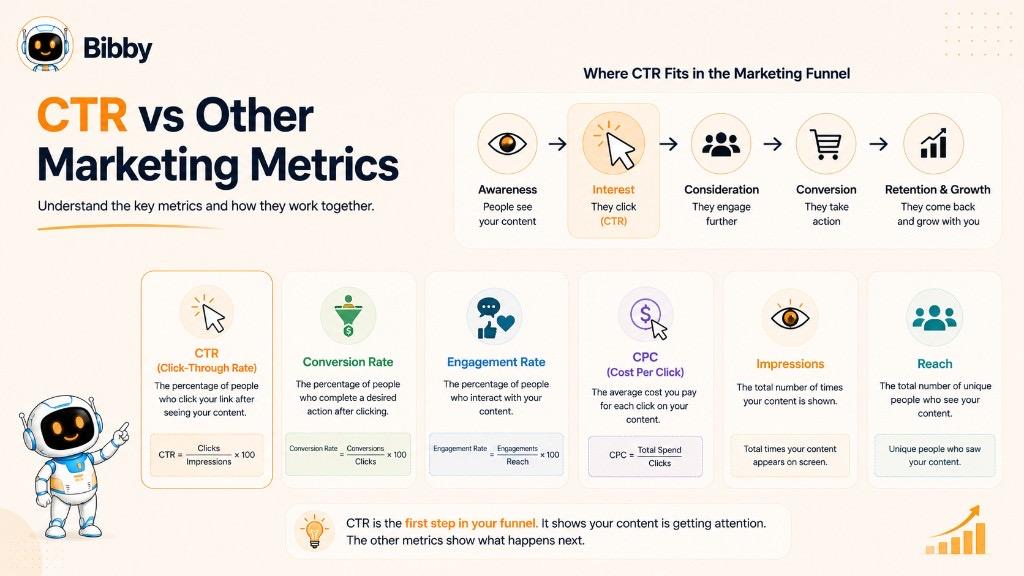
CTR vs Conversion Rate
10,000 impressions → 500 clicks → 50 sign-ups
CTR = 5%. Click-to-conversion rate = 10%.
CTR measures how effectively content generates clicks. Conversion rate measures what visitors do after clicking.
CTR vs Engagement Rate
Engagement rate can include likes, comments, shares, saves, video interactions, and clicks. A post can have high engagement and low CTR if people interact without visiting the destination.
CTR vs Impressions
Impressions = how often content was shown. CTR = how frequently users clicked relative to those impressions.
CTR vs Reach
Reach is unique users who saw the content. A post could have 20,000 reach, 30,000 impressions, and 600 clicks. CTR evaluates click behavior relative to the click-through denominator.
CTR vs CPC
CPC measures the cost of generating clicks in paid campaigns. Strong CTR with efficient CPC can mean the ad attracts clicks without excessive spend—still check conversions and revenue.
CTR vs CPM
CPM is the cost of 1,000 impressions. CTR is the relationship between visibility and clicks. Together they show whether you are paying efficiently for exposure that generates interest.
CTR vs Clicks
Campaign A: 1,000 clicks from 100,000 impressions = 1% CTR
Campaign B: 500 clicks from 10,000 impressions = 5% CTR
Campaign A generated more clicks; Campaign B generated clicks more efficiently.
Impressions → Clicks → Website Visits → Leads → Customers → Revenue
CTR helps you understand the impression-to-click stage. The best campaign is the one that turns relevant attention into meaningful results.
CTR in Different Digital Marketing Channels
The underlying idea is the same everywhere: CTR measures how effectively visibility turns into clicks. Definitions still vary by channel.
CTR in Search Advertising
If an ad receives 10,000 impressions and 500 clicks, CTR is 5%. Headlines, descriptions, keyword relevance, search intent, offer, position, CTA, and brand recognition all influence search CTR.
CTR in SEO
If a page appears 20,000 times in search results and receives 800 clicks, organic CTR is 4%. Title, meta description, search intent, brand familiarity, result features, and ranking position all matter. A top result has a different click opportunity than a result further down.
CTR in Social Media
Use CTR to compare creatives, captions, formats, audiences, and campaigns designed to drive users toward websites, blogs, product pages, landing pages, lead forms, or app downloads.
CTR in Email Marketing
If 10,000 emails are delivered and 400 people click, CTR may be 4% depending on the platform's denominator. Distinguish CTR from open rate—opening and clicking are different actions.
CTR in Display Advertising
Creative, placement, targeting, message, offer, CTA, frequency, and relevance influence banner CTR. Display often reaches people who are not actively searching, so creative and targeting matter even more.
CTR in Affiliate Marketing
If 10,000 visitors view an article and 300 click an affiliate link, CTR is 3%. Revenue still depends on purchases or sign-ups after the click.
CTR in Video Marketing
Video CTR may mean a website link, CTA button, product, or landing page. YouTube thumbnail CTR (impressions that become video views) is conceptually different from clicks to an external website.
Do not conclude that “Platform A at 4% CTR is twice as effective as Platform B at 2%.” Compare same platform + similar audience + similar objective + similar format + similar measurement definition.
Organic CTR vs Paid CTR
Organic CTR measures clicks from unpaid visibility: organic search, unpaid social posts, and unpaid listings.
If a blog post appears 20,000 times in search and receives 800 clicks, organic CTR is 4%.
Paid CTR measures clicks from advertisements. If a Facebook ad receives 50,000 impressions and 1,500 clicks, paid CTR is 3%.
| Factor | Organic CTR | Paid CTR |
|---|---|---|
| Visibility | Unpaid | Paid |
| Common channels | SEO, organic social | Search ads, social ads, display ads |
| Main control factors | Content, ranking, relevance | Creative, targeting, budget, placement |
| Cost per click | Usually no direct media cost | Often tied to advertising spend |
| Optimization | SEO and content strategy | Ad and campaign optimization |
| Audience access | Algorithms and search demand | Influenced through targeting |
Neither is universally better. Organic CTR can generate traffic without paying per click but takes time. Paid CTR can reach targeted audiences faster at a media cost.
A 4% organic CTR and a 4% paid CTR are not automatically comparable. Evaluate each against appropriate benchmarks.
Bibby helps you keep organic publishing consistent—create or generate content, choose a posting style, generate captions, create campaigns, and schedule across major platforms—then use CTR data to guide the next posts.
Why Is My CTR Dropping?
A declining CTR means a smaller percentage of your measured audience is clicking compared with an earlier period. Treat it as a diagnostic signal.
Common Causes
- Creative fatigue — refresh the visual, hook, caption, CTA, or format
- Repetitive content — vary topics, angles, visuals, and formats
- Audience changes — targeting, distribution, or growth may be reaching less-interested people
- Weaker hooks — test problem, benefit, curiosity, question, or insight-led openings
- Unclear CTAs — “See how AI can automate your social media workflow” beats “Learn More”
- Posting time shifts — compare days, periods, platforms, and similar content types
- Weaker offer — ask why the audience would click today
- Increased competition — your content is not viewed in isolation
- Post and landing page misalignment
- Platform or measurement changes — reporting, click definition, tracking, or traffic source
How to Troubleshoot
CTR drops → Check impressions and reach → Check audience → Review creative → Review hook and CTA → Check format → Review timing → Check landing page → Test a new version
Do not panic over a single post. Look for consistent patterns. The useful question is: what changed between the content that performed well and the content that is not performing now?
How to Track CTR Effectively
A useful tracking process answers three questions: Are people clicking? What is encouraging them to click? Are those clicks producing meaningful results?
1. Track Clicks, Impressions, and CTR
20,000 impressions + 600 clicks = 3% CTR. Do not rely on clicks alone.
2. Establish a Baseline
Average CTR across similar posts, campaigns, audiences, platforms, formats, and time periods. If comparable LinkedIn posts typically sit between 1.5% and 2.5%, a 3.2% result deserves a closer look.
3. Compare Similar Content
Do not compare a paid product ad with an organic educational carousel as if they were the same test.
4. Track CTR by Platform
| Platform | Impressions | Clicks | CTR |
|---|---|---|---|
| 20,000 | 400 | 2% | |
| 25,000 | 375 | 1.5% | |
| 10,000 | 400 | 4% | |
| TikTok | 30,000 | 450 | 1.5% |
Platform definitions can differ, so treat figures as directional rather than perfectly interchangeable.
5. Track CTR by Format, Caption, and CTA
Compare images, carousels, videos, Stories, and ads. Test “Learn More,” “See How It Works,” and “Get the Free Guide” under similar conditions.
6. Track CTR Over Time
A climb from 1.8% to 3.0% over four weeks may show the strategy improving. A drop from 3.4% to 1.6% may signal fatigue, declining relevance, or distribution changes.
7. Track CTR With Conversion Metrics
10,000 impressions → 500 clicks → 50 leads means 5% CTR and a 10% click-to-lead rate.
Visibility → Clicks → Conversion → Business Result
Impressions → CTR → Clicks → Conversion Rate → Leads/Sales → Revenue
Use winning patterns—topic, hook, visual, CTA, platform, timing, audience, and post-click results—to brief the next batch of content.
CTR Example for a Social Media Campaign
A SaaS company promotes an AI-powered social media automation guide on LinkedIn.
- Impressions: 25,000
- Clicks: 750
- CTR: 3%
CTR = (750 ÷ 25,000) × 100 = 3%
If previous comparable posts averaged 1.8% CTR, 3% is a meaningful improvement.
Those 750 clicks produce 90 guide downloads:
Click-to-conversion rate = (90 ÷ 750) × 100 = 12%
25,000 impressions → 750 clicks → 90 conversions
Now compare a second campaign with a higher CTR but weaker conversions:
| Metric | Campaign A | Campaign B |
|---|---|---|
| Impressions | 25,000 | 25,000 |
| Clicks | 750 | 1,250 |
| CTR | 3% | 5% |
| Conversions | 90 | 25 |
| Click-to-conversion rate | 12% | 2% |
Campaign B generated more clicks. Campaign A produced more conversions. A higher CTR does not necessarily mean better overall performance.
Investigate why Campaign A generated fewer clicks but more conversions—more specific audience, clearer offer, better-qualified traffic, stronger message-to-landing-page match, or a better CTA. Then try to increase clicks without reducing conversion quality.
CTR Optimization Checklist
Use this checklist before, during, and after publishing click-focused content.
Before Publishing
- Define the objective — traffic, leads, sales, downloads, or sign-ups
- Understand the audience — relevance before cleverness
- Create a strong hook — a reason to stop scrolling
- Use a relevant visual — image, carousel, video, or Story that supports the message
- Write a clear caption — explain the value
- Add a specific CTA — tell users exactly what to do next
- Match the CTA with the destination — the landing page must deliver the promise
- Choose the right format — fit the objective
- Check the link — destination works and is relevant
- Consider publishing time — use historical audience data
During Testing
- Test hooks, visuals, captions, CTAs, formats, and times
- Keep comparisons consistent (audience, platform, objective, content type)
- Change one major variable at a time
After Publishing
- Record impressions, clicks, and CTR using (Clicks ÷ Impressions) × 100
- Compare with previous similar content
- Check engagement and conversions
- Review the landing page
- Identify patterns and apply the learning
Don't optimize for clicks alone. Optimize for relevant clicks that lead to meaningful results.
Relevant Audience + Valuable Content + Strong Creative + Clear CTA + Good Timing + Relevant Destination + Continuous Testing
Key Takeaways
- CTR (Click-Through Rate) is the percentage of people who click after seeing your content: (Clicks ÷ Impressions) × 100.
- CTR measures the impression-to-click stage—not conversions, revenue, or overall campaign success.
- There is no universal good CTR. Compare similar content on the same platform against your own baseline.
- A higher CTR is not always better. Qualified traffic can beat curiosity clicks.
- Improve CTR by testing hooks, visuals, captions, CTAs, formats, targeting, timing, and landing-page alignment—one variable at a time.
- Bibby helps you create, caption, schedule, and test social content so CTR becomes a feedback loop: Create → Publish → Measure → Learn → Improve.