
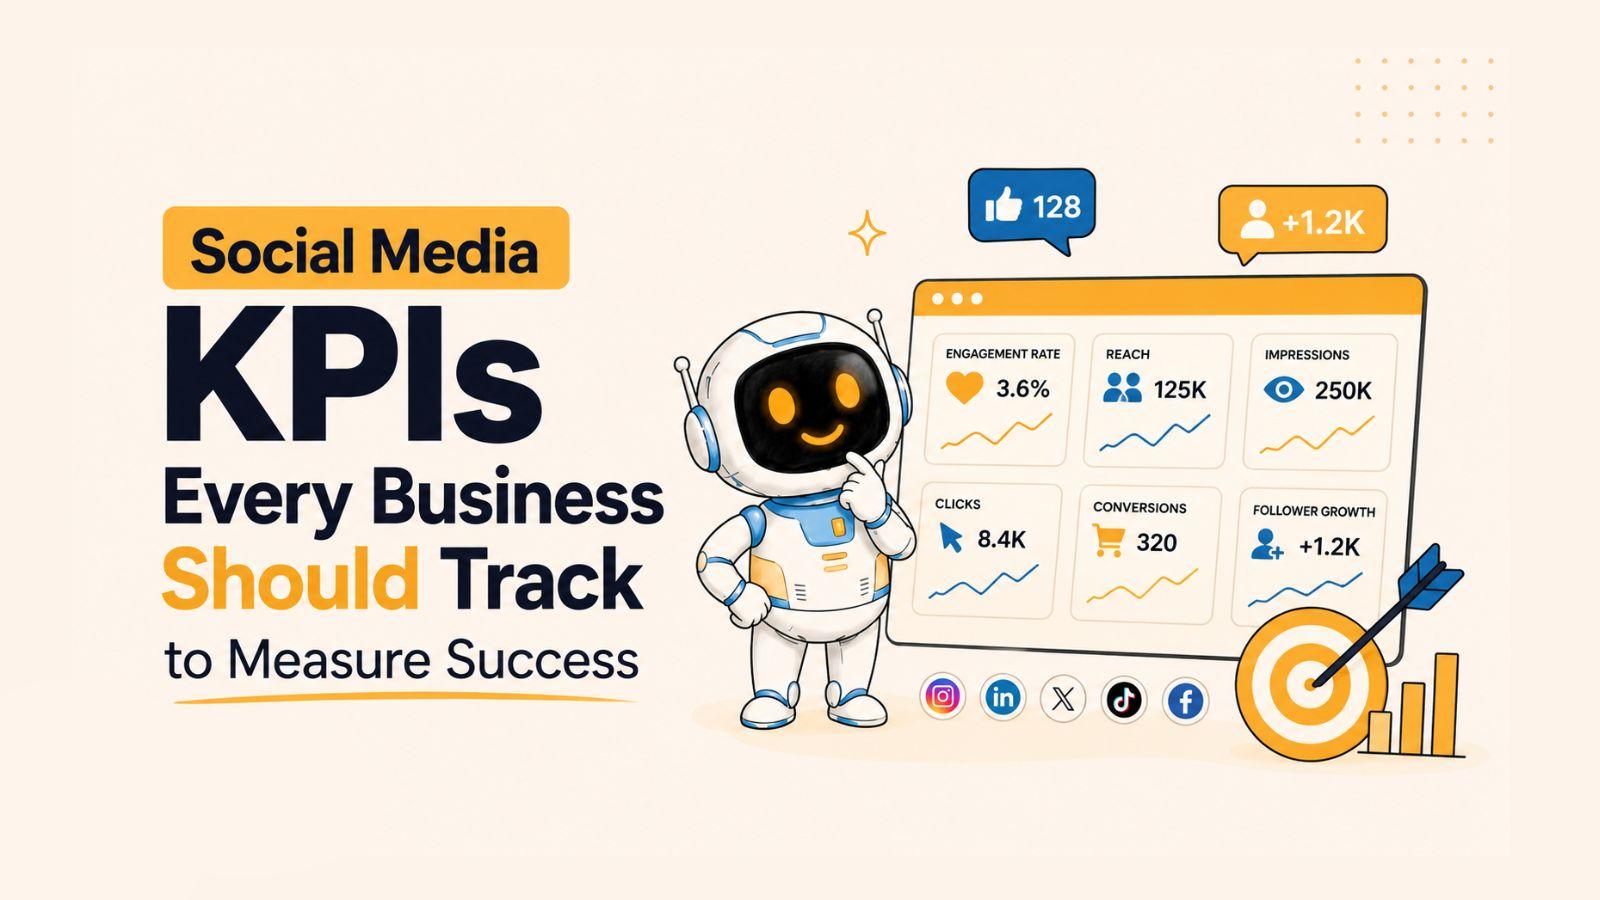
Social media has evolved from a communication channel into one of the most powerful tools for building brand awareness, generating leads, and driving revenue.
Yet many businesses struggle to determine whether their social media efforts are actually contributing to their goals because they focus on vanity metrics rather than meaningful performance indicators. The key to making smarter marketing decisions is tracking the right social media KPIs (Key Performance Indicators) that directly connect social activity to business outcomes.
In this article, you will learn:
- The most important social media KPIs for measuring business growth
- How to connect social media performance to leads and revenue
- How to build a KPI tracking system that improves results
Whether you're a small business owner, marketing manager, or social media specialist, understanding which KPIs matter—and how to interpret them—will help you optimize campaigns, justify marketing investments, and achieve better business outcomes.
Let's start by understanding what social media KPIs are and why they play such a critical role in measuring success.
Also read: How to Stay Consistent on Social Media: A Practical System for Sustainable Growth
What Are Social Media KPIs?
Social media KPIs (Key Performance Indicators) are measurable values that help businesses evaluate how effectively their social media activities are contributing to specific business objectives. Unlike general metrics, KPIs are directly tied to strategic goals such as increasing brand awareness, generating leads, driving website traffic, improving customer engagement, or boosting sales.
For example, a business focused on brand awareness may track reach and impressions as key KPIs. A company prioritizing lead generation may pay closer attention to click-through rates, form submissions, and cost per lead. The right KPI depends on what success looks like for your organization.
Defining Social Media KPIs
Many marketers use the terms "metrics" and "KPIs" interchangeably, but they are not the same.
A metric is any measurable data point collected from your social media platforms. Examples include likes, comments, shares, follower count, video views, and profile visits.
A KPI, on the other hand, is a metric that has been identified as critical to achieving a business goal. While every KPI is a metric, not every metric qualifies as a KPI.
Consider this example:
- Metric: Total Instagram followers
- KPI: Monthly follower growth rate tied to brand awareness goals
Similarly:
- Metric: Number of post likes
- KPI: Engagement rate measured against campaign objectives
The distinction is important because focusing on KPIs helps businesses avoid getting distracted by numbers that may look impressive but have little impact on overall performance.
Why Businesses Need Social Media KPIs
Tracking social media KPIs provides valuable insights that support better decision-making across marketing and business operations.
1. Measure Return on Investment (ROI)
Business leaders want to know whether social media investments are producing results. KPIs provide the data needed to demonstrate the value of campaigns and justify marketing budgets.
2. Improve Campaign Performance
By monitoring KPIs regularly, marketers can identify what's working and what isn't. This allows teams to adjust content strategies, targeting, posting schedules, and advertising efforts for better outcomes.
3. Align Marketing With Business Goals
KPIs ensure that social media activities support broader organizational objectives. Rather than chasing engagement for its own sake, businesses can focus on metrics that contribute to growth.
4. Make Data-Driven Decisions
Reliable KPI data helps eliminate guesswork. Decisions about content creation, budget allocation, audience targeting, and platform selection become more strategic when backed by measurable performance indicators.
5. Benchmark and Track Progress
KPIs make it easier to compare performance over time and against competitors. Businesses can establish benchmarks, set realistic targets, and continuously optimize their social media strategy.
Ultimately, social media KPIs transform raw data into actionable insights. Instead of simply collecting numbers, businesses gain a clearer understanding of how social media contributes to awareness, engagement, customer acquisition, and revenue growth.
Want to know, how AI scheduling tools for LinkedIn optimize posting times automatically?
How to Choose the Right Social Media KPIs
One of the biggest mistakes businesses make is tracking every available metric instead of focusing on the indicators that directly support their goals. The most effective social media KPI strategy starts with a clear understanding of what the business wants to achieve and then selecting metrics that accurately measure progress toward those objectives.
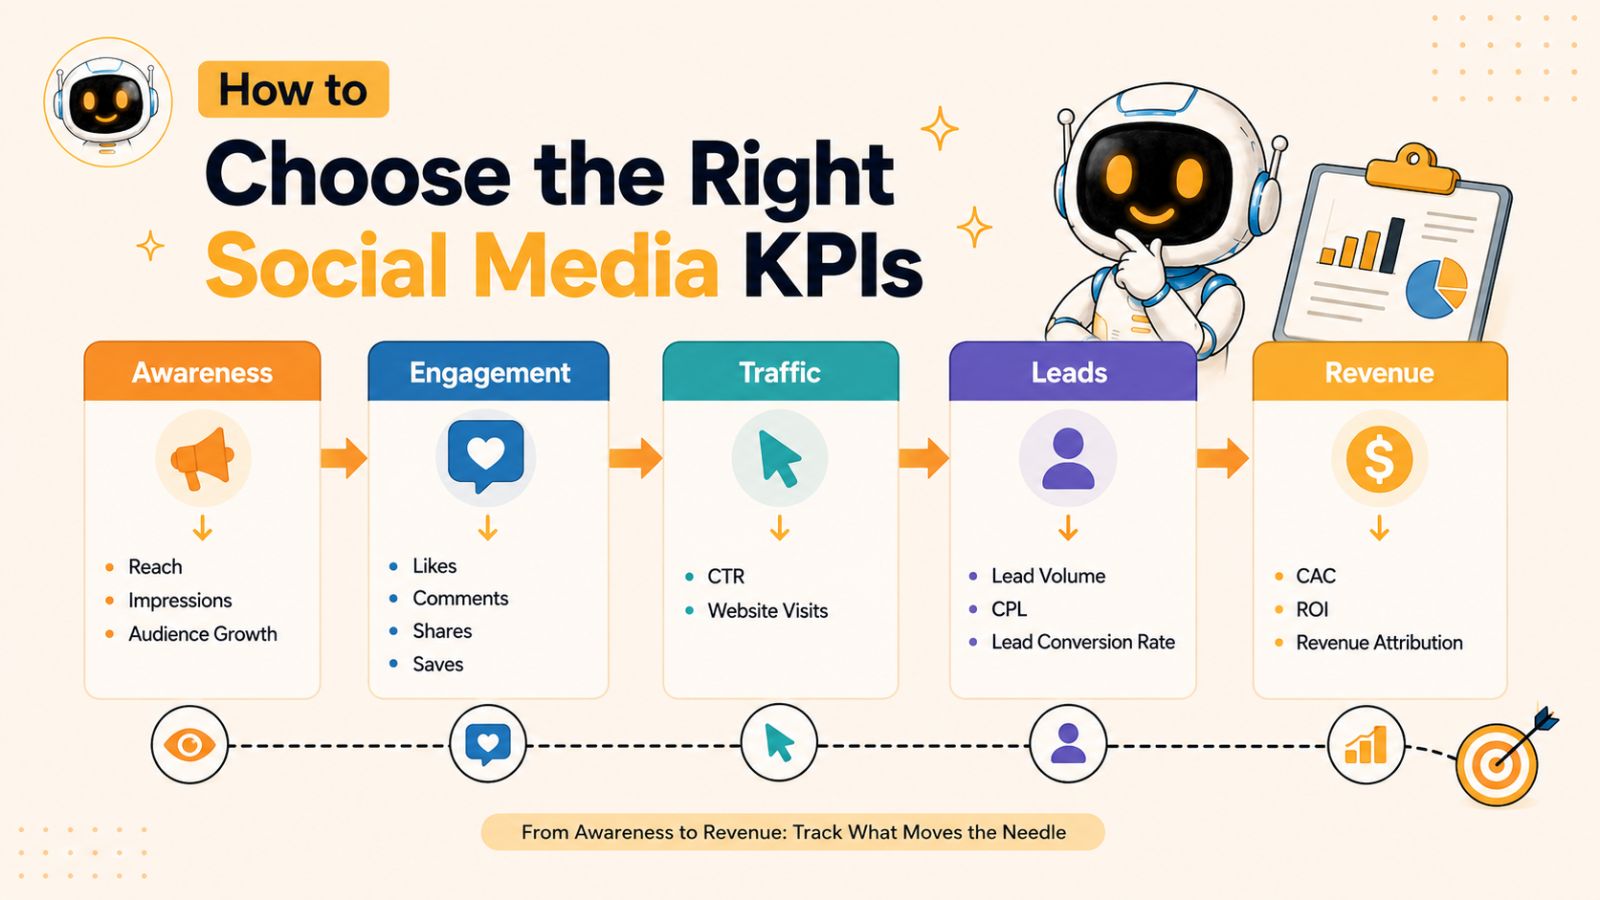
Rather than asking, "What metrics can we track?" businesses should ask, "What outcomes are we trying to achieve?" The answer will determine which KPIs deserve the most attention.
Align KPIs With Business Goals
Different business objectives require different KPIs. A metric that is critical for one company may be irrelevant for another.
Brand Awareness Goals
If the objective is to increase visibility and introduce the brand to a larger audience, awareness-focused KPIs should be prioritized.
Key KPIs include:
- Reach
- Impressions
- Audience growth rate
- Share of voice
- Brand mentions
These metrics help determine how many people are seeing your content and how your brand presence compares to competitors.
Customer Engagement Goals
Businesses that want to build stronger relationships with their audience should focus on engagement metrics.
Key KPIs include:
- Engagement rate
- Comments
- Shares
- Saves
- Video interactions
Strong engagement often signals that content resonates with the target audience and encourages meaningful interactions.
Website Traffic Goals
When social media is used to drive visitors to a website, traffic-related KPIs become more important.
Key KPIs include:
- Click-through rate (CTR)
- Link clicks
- Social referral traffic
- Bounce rate
- Average session duration
These indicators help measure both the quantity and quality of traffic generated through social channels.
Lead Generation Goals
For businesses using social media to capture prospects, lead-focused KPIs should take priority.
Key KPIs include:
- Lead volume
- Cost per lead (CPL)
- Lead conversion rate
- Form completion rate
Tracking these metrics helps evaluate the efficiency and effectiveness of lead-generation campaigns.
Revenue and Sales Goals
Businesses focused on direct revenue generation should monitor financial performance metrics.
Key KPIs include:
- Conversion rate
- Customer acquisition cost (CAC)
- Revenue from social media
- Return on investment (ROI)
These KPIs reveal how social media contributes to bottom-line business results.
Create SMART KPI Targets
Selecting KPIs is only part of the process. Businesses should also establish clear performance targets.
A useful framework is SMART goals:
- Specific
- Measurable
- Achievable
- Relevant
- Time-bound
For example, instead of setting a vague goal such as "increase engagement," a SMART KPI target would be:
"Increase Instagram engagement rate from 3% to 5% within the next six months."
Specific targets provide a benchmark for evaluating success and help teams stay focused on meaningful outcomes.
Common KPI Selection Mistakes
Even experienced marketers can fall into the trap of tracking the wrong data. Avoiding these common mistakes can significantly improve reporting accuracy and decision-making.
Tracking Too Many Metrics
Monitoring dozens of metrics often creates information overload. Focus on a smaller set of KPIs that directly align with your goals.
Prioritizing Vanity Metrics
Large follower counts and high numbers of likes may look impressive, but they don't always translate into business value. Meaningful KPIs should contribute to awareness, engagement, leads, or revenue.
Ignoring Conversion Data
Many businesses track engagement but fail to measure what happens after a user clicks. Conversion-related KPIs are essential for understanding the true impact of social media efforts.
Using the Same KPIs Across Every Platform
Each platform serves a different purpose and audience. A KPI that matters on LinkedIn may not be as important on TikTok or Instagram. Tailor your KPI strategy to each platform's strengths.
Failing to Review KPIs Regularly
Business goals evolve over time. KPIs should be reviewed periodically to ensure they remain aligned with current priorities and market conditions.
Choosing the right social media KPIs allows businesses to focus on what truly matters. Once the proper KPIs are aligned with business objectives, the next step is understanding which awareness metrics can help measure and expand your brand's visibility.
Also read: Why Every Small Business Should Use a Social Media Scheduling Tool?
Awareness KPIs Every Business Should Track
Before businesses can generate leads, drive sales, or build customer loyalty, people need to know they exist. That's why awareness is often the first stage of the social media marketing funnel. Awareness KPIs help businesses measure how effectively their content is reaching new audiences and expanding brand visibility.
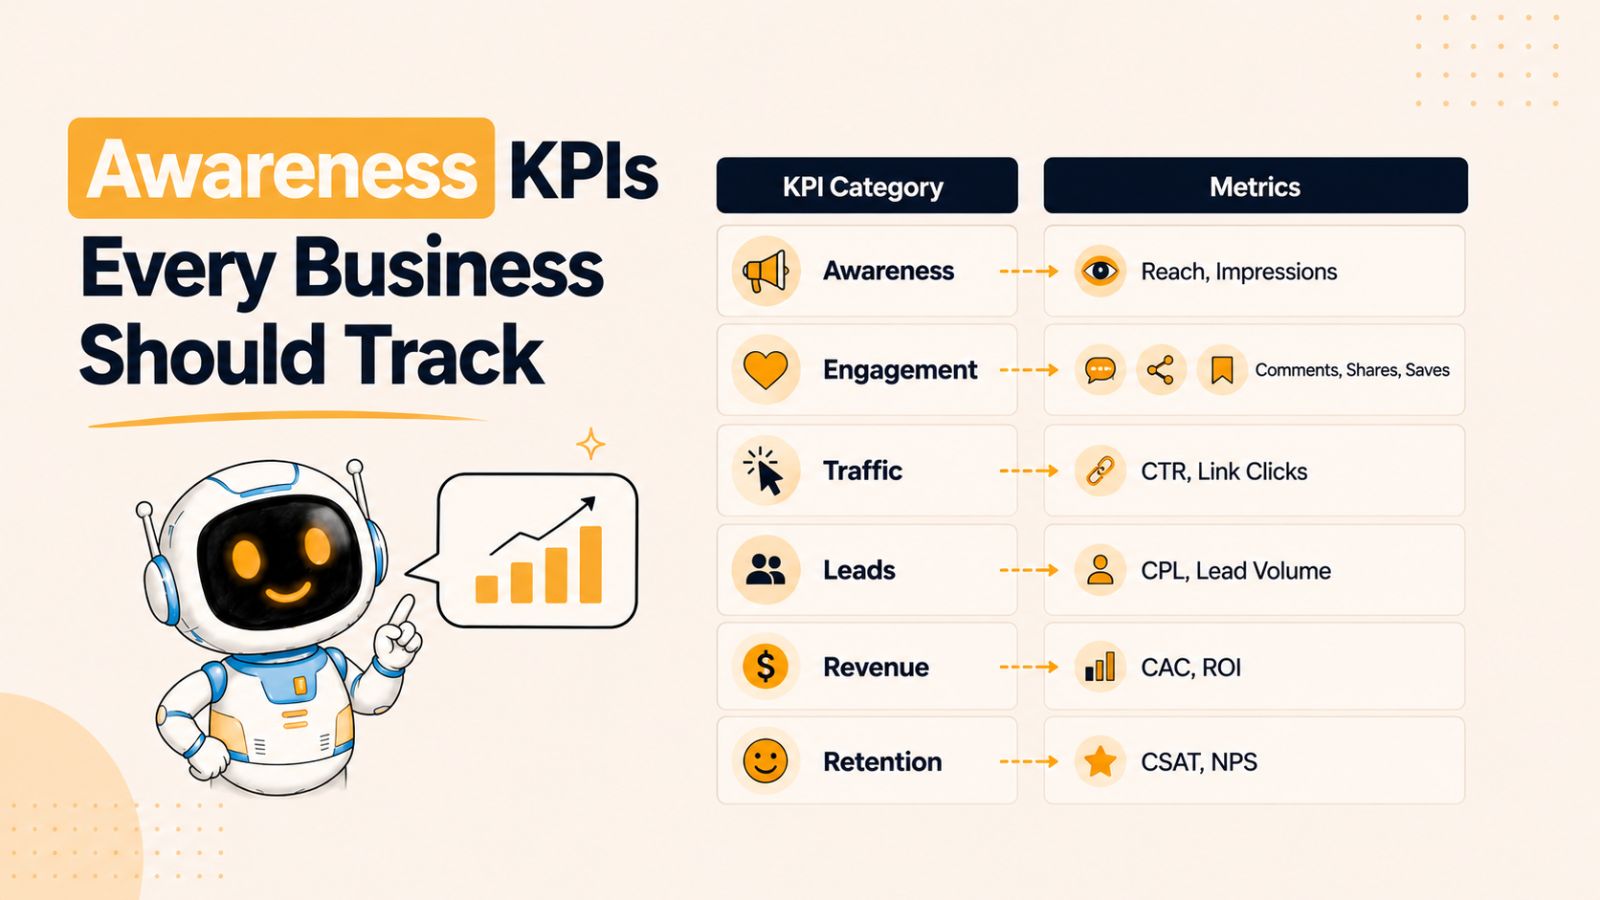
While awareness metrics don't always translate directly into revenue, they play a critical role in creating opportunities for future engagement, conversions, and customer acquisition.
The following awareness KPIs provide valuable insights into how well your brand is capturing attention across social platforms.
Reach
Reach measures the number of unique users who see your content during a specific period.
Unlike other metrics that may count multiple views from the same person, reach focuses on individual users. This makes it one of the clearest indicators of how many people your brand is exposing to its message.
Why Reach Matters
A growing reach indicates that your content is being distributed to a larger audience. This can occur through:
- Organic content performance
- Shares and reposts
- Influencer collaborations
- Paid social campaigns
- Platform algorithm recommendations
Consistently increasing reach suggests that your brand awareness efforts are moving in the right direction.
How to Improve Reach
Businesses can expand reach by:
- Publishing high-quality content consistently
- Using relevant hashtags and keywords
- Encouraging audience sharing
- Partnering with influencers and creators
- Investing in targeted social media advertising
While reach shows how many people see your content, it doesn't reveal how often they see it. That's where impressions become important.
Impressions
Impressions represent the total number of times content is displayed on users' screens.
Unlike reach, impressions count every view, including repeated views from the same user.
For example:
- Reach: 1,000 unique users
- Impressions: 3,500 total views
This means some users saw the content multiple times.
Why Impressions Matter
High impressions can indicate:
- Strong content distribution
- Frequent audience exposure
- Effective advertising campaigns
- Increased brand recall opportunities
Repeated exposure often strengthens brand recognition because consumers typically need multiple interactions before remembering or trusting a brand.
Reach vs. Impressions
Many marketers confuse these metrics, but both provide unique insights:
| Metric | Measures |
|---|---|
| Reach | Number of unique people who see content |
| Impressions | Total number of times content is displayed |
Monitoring both metrics helps businesses understand audience size and content visibility.
Audience Growth Rate
Follower count alone can be misleading. A brand with 500,000 followers that gains only a few hundred new followers each month may actually be growing more slowly than a smaller competitor.
Audience growth rate measures the speed at which your social media audience is expanding.
Audience Growth Rate Formula
Audience Growth Rate = (New Followers ÷ Total Followers) × 100
For example:
- Existing followers: 10,000
- New followers this month: 500
Growth Rate = (500 ÷ 10,000) × 100 = 5%
Why Growth Rate Matters
This KPI provides a clearer picture of momentum than total follower count alone. A healthy growth rate often indicates:
- Effective content strategy
- Strong audience interest
- Increased brand visibility
- Successful promotional campaigns
Businesses should track growth trends over time rather than focusing solely on short-term spikes.
Brand Mentions
Brand mentions occur whenever users reference your company, products, services, or brand name on social media.
Mentions may be:
- Tagged mentions
- Direct references
- User-generated content
- Customer reviews
- Influencer discussions
Why Brand Mentions Matter
Mentions indicate how frequently people are talking about your business. Rising mention volume often signals growing awareness and audience interest.
Brand mentions also help businesses:
- Monitor reputation
- Discover customer feedback
- Identify emerging trends
- Measure campaign impact
Positive mention growth is often a strong indicator that brand visibility efforts are succeeding.
Also read: Best Hootsuite Alternative for Small Business
Share of Voice (SOV)
Share of Voice measures how much of the online conversation within your industry belongs to your brand compared to competitors.
For example, if consumers generate 10,000 social media mentions about companies in your industry and 2,500 mention your brand, your Share of Voice is 25%.
Why Share of Voice Matters
SOV provides competitive context that reach and impressions cannot offer.
A strong Share of Voice can indicate:
- Greater market visibility
- Stronger brand recognition
- Competitive positioning
- Increased authority within an industry
Many businesses use SOV to benchmark performance against competitors and evaluate the effectiveness of branding campaigns.
Video Views and Video Reach
As short-form video continues to dominate platforms like Instagram, TikTok, YouTube, and Facebook, video-specific awareness metrics have become increasingly important.
Key video awareness metrics include:
- Video views
- Unique video viewers
- Video reach
- Average watch time
- Video completion rate
Why Video Awareness Metrics Matter
Video often receives preferential treatment from platform algorithms and can dramatically expand brand exposure.
Strong video performance typically leads to:
- Greater organic reach
- Higher engagement opportunities
- Increased follower growth
- Better content discoverability
Businesses investing heavily in video content should monitor these metrics alongside traditional awareness KPIs.
Measuring Awareness Effectively
No single awareness KPI tells the entire story. Reach, impressions, audience growth, brand mentions, Share of Voice, and video visibility metrics work together to provide a comprehensive view of brand awareness performance.
When analyzed collectively, these KPIs help businesses answer critical questions:
- Are more people discovering our brand?
- Is our visibility increasing over time?
- How do we compare to competitors?
- Which content formats generate the greatest exposure?
Once awareness is established, the next challenge is turning visibility into meaningful interactions. That's where engagement KPIs become essential.
Engagement KPIs That Reveal Audience Interest
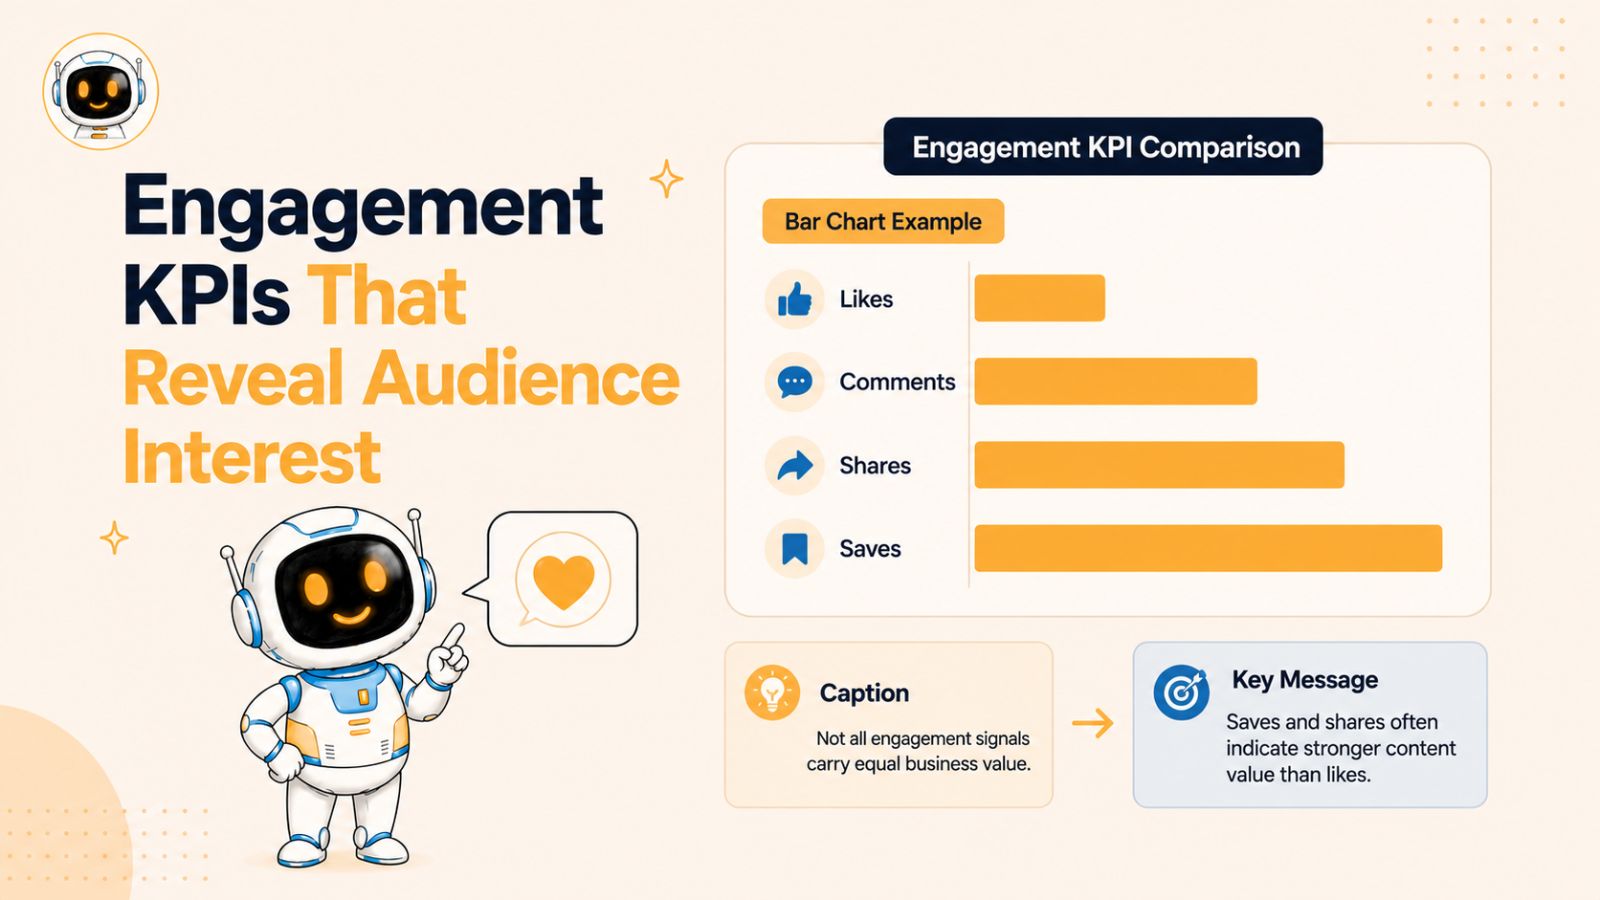
Awareness tells you how many people are seeing your content, but engagement reveals how people are responding to it. Engagement KPIs help businesses understand whether their audience finds their content valuable, relevant, entertaining, or useful enough to interact with.
Strong engagement is often a sign that your content resonates with your target audience. It can also increase organic reach, improve visibility in platform algorithms, and strengthen relationships with potential customers.
The following engagement KPIs provide a deeper understanding of audience behavior and content performance.
Engagement Rate
Engagement rate is one of the most important social media KPIs because it measures audience interaction relative to content exposure.
Rather than focusing on raw numbers of likes or comments, engagement rate shows how actively people engage with your content.
Engagement Rate Formula
One commonly used formula is:
Engagement Rate = (Total Engagements ÷ Reach) × 100
Engagements may include:
- Likes
- Comments
- Shares
- Saves
- Reactions
- Clicks
For example:
- Reach: 10,000 users
- Total engagements: 600
Engagement Rate = (600 ÷ 10,000) × 100 = 6%
Why Engagement Rate Matters
Engagement rate helps normalize performance across audiences of different sizes.
A smaller account with a 10% engagement rate may be performing far better than a larger account with a 1% engagement rate.
Benefits of tracking engagement rate include:
- Measuring content relevance
- Identifying top-performing posts
- Comparing campaign performance
- Understanding audience interest
Because it combines multiple interactions into a single metric, engagement rate often serves as a primary indicator of content effectiveness.
Likes, Reactions, and Favorites
Likes are among the most common forms of social media engagement.
Although they require minimal effort from users, likes still provide useful signals about content appeal.
What Likes Tell You
High like counts can indicate:
- Positive audience response
- Content relevance
- Visual appeal
- Brand affinity
However, likes alone should never be treated as a primary KPI because they do not necessarily indicate meaningful engagement or business impact.
Instead, they should be evaluated alongside deeper engagement metrics.
Comments
Comments represent a higher level of engagement because they require users to invest time and effort in responding.
Why Comments Matter
Comments often indicate:
- Strong audience interest
- Active discussions
- Emotional reactions
- Community participation
Posts that generate comments frequently receive greater algorithmic visibility on many platforms.
Businesses should also analyze comment quality rather than simply counting total comments. Thoughtful discussions typically provide more value than generic responses.
Shares and Reposts
Shares occur when users distribute your content to their own audience.
Many marketers consider shares one of the most valuable engagement signals because they amplify reach while acting as a form of endorsement.
Why Shares Matter
When someone shares content, they are effectively telling their audience:
"This content is worth seeing."
High share counts often indicate:
- Strong content value
- Educational usefulness
- Emotional impact
- Viral potential
Content that consistently generates shares can significantly expand brand awareness without additional advertising costs.
Saves and Bookmarks
Saves allow users to store content for future reference.
Platforms such as Instagram increasingly view saves as a strong indicator of content quality because they suggest long-term value rather than momentary interest.
Why Saves Matter
Users often save content that is:
- Educational
- Informative
- Inspirational
- Actionable
Examples include:
- How-to guides
- Checklists
- Tutorials
- Industry insights
A high save rate often signals that content is providing meaningful value to the audience.
Video Engagement Metrics
Video content now dominates most major social platforms, making video-specific engagement KPIs essential.
Average Watch Time
Average watch time measures how long viewers spend watching a video.
Longer watch times typically indicate:
- Strong audience interest
- Effective storytelling
- Relevant content
Platforms often reward videos that retain viewers for longer periods.
Video Completion Rate
Completion rate measures the percentage of viewers who watch a video from start to finish.
Completion Rate = (Completed Views ÷ Total Views) × 100
A high completion rate suggests that viewers find the content engaging enough to watch until the end.
Audience Retention
Audience retention shows where viewers drop off during a video.
This KPI helps businesses identify:
- Weak introductions
- Uninteresting segments
- Effective storytelling techniques
- Opportunities for improvement
Analyzing retention data can significantly improve future video performance.
Click Engagement
Not all engagement happens directly on social platforms. Some interactions involve taking action beyond the post itself.
Important click-related engagement metrics include:
- Link clicks
- Profile visits
- Button clicks
- Story swipe-ups
- Product tag interactions
These actions often indicate stronger purchase intent than passive engagements such as likes or views.
For businesses focused on lead generation or sales, click engagement can be one of the most meaningful indicators of audience interest.
Engagement Quality vs. Engagement Quantity
A common mistake is focusing solely on the volume of engagement.
For example:
- 500 generic likes may provide less value than 50 meaningful comments.
- 100 shares may generate more business impact than 1,000 reactions.
- 20 saves may indicate stronger long-term value than hundreds of views.
The quality of engagement often matters more than the quantity.
Businesses should evaluate not only how often users interact with content but also the type of interaction being generated.
Measuring Engagement Effectively
No single engagement KPI provides a complete picture of audience interest. The most successful businesses analyze engagement rate, comments, shares, saves, video interactions, and click behavior together.
These metrics help answer important questions such as:
- Does our content resonate with our audience?
- Which content formats generate the strongest response?
- Are users actively participating or passively consuming content?
- What types of engagement lead to meaningful business outcomes?
Once businesses understand how effectively they are engaging their audience, the next step is measuring how social media drives users to owned digital assets such as websites and landing pages.
Website Traffic KPIs From Social Media
Engagement on social media is valuable, but for many businesses, the ultimate goal is to move users from social platforms to owned digital properties such as websites, landing pages, online stores, or lead-generation forms.
Website traffic KPIs help measure how effectively social media drives users to take that next step. These metrics provide critical insights into audience intent, content effectiveness, and the overall contribution of social media to the customer journey.
By tracking traffic-related KPIs, businesses can determine not only how many visitors social media generates but also the quality of those visitors.
Click-Through Rate (CTR)
Click-Through Rate (CTR) measures the percentage of users who click a link after seeing your content.
CTR is one of the most important indicators of how compelling your content, calls-to-action (CTAs), and offers are.
CTR Formula
CTR = (Total Clicks ÷ Total Impressions) × 100
For example:
- Impressions: 50,000
- Link clicks: 1,500
CTR = (1,500 ÷ 50,000) × 100 = 3%
Why CTR Matters
A strong CTR often indicates that:
- Content aligns with audience interests
- Headlines capture attention
- Calls-to-action are persuasive
- Offers are relevant
Conversely, a low CTR may suggest that users see the content but are not motivated to take action.
How to Improve CTR
Businesses can improve click-through rates by:
- Writing stronger headlines
- Using clearer calls-to-action
- Highlighting benefits instead of features
- Creating curiosity-driven content
- Testing different visuals and formats
CTR is often one of the earliest indicators of whether a social campaign is likely to generate meaningful business results.
Link Clicks
Link clicks represent the total number of times users click on links within social media content.
Unlike CTR, which provides a percentage-based measure, link clicks show the raw volume of traffic-driving actions.
Why Link Clicks Matter
Tracking link clicks helps businesses:
- Evaluate campaign performance
- Measure audience interest
- Identify top-performing content
- Compare content formats
A post may generate thousands of impressions, but if very few users click through, its business impact may be limited.
Combining link clicks with CTR creates a more complete view of traffic generation performance.
Social Referral Traffic
Social referral traffic refers to website visitors who arrive from social media platforms.
Most analytics tools classify traffic sources automatically, allowing businesses to identify exactly how much website traffic originates from channels such as:
- TikTok
- X (Twitter)
- YouTube
Why Social Referral Traffic Matters
This KPI helps answer questions such as:
- Which platform drives the most traffic?
- Which campaigns generate the highest visitor volume?
- Are social media efforts contributing to website growth?
By comparing referral traffic across platforms, businesses can allocate resources more effectively and prioritize channels that deliver the best results.
Bounce Rate
Bounce rate measures the percentage of visitors who leave a website without taking another action.
For example, if a user lands on a page and exits without clicking, scrolling significantly, or visiting another page, that session may be counted as a bounce depending on the analytics platform being used.
Why Bounce Rate Matters
Bounce rate helps evaluate traffic quality.
A high bounce rate may indicate:
- Misleading content or headlines
- Poor landing page experience
- Slow website performance
- Weak content relevance
- Audience targeting issues
A lower bounce rate generally suggests that visitors find the content useful enough to continue exploring the website.
Average Session Duration
Average session duration measures how much time visitors spend on a website after arriving from social media.
Why Session Duration Matters
Longer sessions often indicate:
- Strong content engagement
- Relevant audience targeting
- Positive user experience
- Effective landing pages
When visitors spend more time on a website, they are typically more likely to convert into leads or customers.
Businesses should compare session duration across traffic sources to determine which social platforms attract the most engaged visitors.
Pages Per Session
Pages per session measures the average number of pages visitors view during a single website visit.
Why Pages Per Session Matters
This KPI helps businesses understand how deeply users engage with their website.
Higher pages-per-session values often indicate:
- Strong content discovery
- Effective internal linking
- High visitor interest
- Better user experience
For example, a visitor who reads multiple blog posts or explores several product pages demonstrates greater engagement than someone who immediately leaves.
Landing Page Conversion Rate
Driving traffic is only valuable if visitors take meaningful actions once they arrive.
Landing page conversion rate measures the percentage of social media visitors who complete a desired action.
These actions may include:
- Submitting a contact form
- Downloading a resource
- Scheduling a consultation
- Requesting a demo
- Making a purchase
Conversion Rate Formula
Landing Page Conversion Rate = (Conversions ÷ Visitors) × 100
This KPI helps connect social media traffic directly to business outcomes.
Traffic Quality Metrics
Many businesses focus heavily on traffic volume while overlooking traffic quality.
A campaign that generates 20,000 visitors may actually perform worse than one that generates 2,000 highly qualified visitors.
To assess traffic quality, businesses should evaluate metrics such as:
- Bounce rate
- Session duration
- Pages per session
- Conversion rate
- Returning visitor rate
These indicators reveal whether social traffic is attracting genuinely interested prospects or simply generating clicks without meaningful engagement.
Attribution and Traffic Measurement
One challenge with traffic analysis is accurately attributing website visits to social media efforts.
Businesses can improve attribution by using:
- UTM tracking parameters
- Campaign-specific URLs
- Marketing automation tools
- Conversion tracking systems
- Analytics platform integrations
Proper attribution ensures that traffic and conversions are credited to the correct campaigns and channels.
Measuring Website Traffic Effectively
Website traffic KPIs bridge the gap between social media engagement and business outcomes. They help businesses understand whether their content motivates users to take action beyond the social platform itself.
When analyzed together, metrics such as CTR, link clicks, referral traffic, bounce rate, session duration, and landing page conversion rate provide a comprehensive view of traffic performance.
These KPIs help answer critical questions:
- Are social media users visiting our website?
- Which platforms drive the most qualified traffic?
- Are visitors engaging with our content?
- How effectively are landing pages converting traffic into leads or customers?
For businesses focused on growth, traffic is often just one step in the journey. The next stage is measuring how social media contributes to lead generation and customer acquisition.
Lead Generation KPIs for Social Media Success
For many businesses, social media is more than a branding channel—it's a lead generation engine. Whether the goal is collecting email subscribers, booking consultations, requesting demos, or generating sales inquiries, lead generation KPIs help measure how effectively social media turns audience attention into potential customers.
Tracking these metrics allows businesses to understand which campaigns, platforms, and content types contribute most to pipeline growth and revenue opportunities.
Lead Volume
Lead volume measures the total number of leads generated through social media campaigns during a specific period.
A lead may include:
- Newsletter signups
- Contact form submissions
- Demo requests
- Consultation bookings
- Webinar registrations
- Free trial signups
Why Lead Volume Matters
Lead volume provides a clear indication of how successfully social media is attracting potential customers.
By monitoring lead volume over time, businesses can identify:
- High-performing campaigns
- Effective content formats
- Seasonal trends
- Platform-specific opportunities
For example, a company may discover that LinkedIn generates fewer leads than Instagram but attracts significantly higher-quality prospects.
Cost Per Lead (CPL)
Cost Per Lead measures how much it costs to acquire a single lead through social media marketing efforts.
CPL Formula
Cost Per Lead = Total Campaign Spend ÷ Total Leads Generated
For example:
- Campaign spend: $2,000
- Leads generated: 100
CPL = $20 per lead
Why CPL Matters
Generating leads is important, but generating them efficiently is even more important.
A lower CPL often indicates:
- Better audience targeting
- More effective messaging
- Higher-performing creatives
- Improved campaign optimization
Businesses should evaluate CPL alongside lead quality rather than focusing exclusively on reducing acquisition costs.
Lead Conversion Rate
Lead conversion rate measures the percentage of visitors or prospects who become leads after interacting with social media content.
Lead Conversion Rate Formula
Lead Conversion Rate = (Leads Generated ÷ Visitors) × 100
For example:
- Landing page visitors: 5,000
- Leads generated: 250
Lead Conversion Rate = 5%
Why Lead Conversion Rate Matters
This KPI helps determine how effectively your content, offer, and landing page work together to encourage action.
A low conversion rate may indicate:
- Weak calls-to-action
- Poor offer alignment
- Complicated forms
- Landing page issues
- Audience targeting problems
Improving conversion rates often delivers a greater return than simply increasing traffic volume.
Form Completion Rate
Many social media campaigns direct users to forms where they can submit their information.
Form completion rate measures how many users finish the form after starting it.
Form Completion Rate Formula
Form Completion Rate = (Completed Forms ÷ Form Starts) × 100
Why Form Completion Rate Matters
A low completion rate may suggest:
- Forms are too long
- Questions are unnecessary
- User experience is poor
- Trust signals are lacking
Businesses can improve form completion rates by reducing friction and requesting only essential information.
Marketing Qualified Leads (MQLs)
Not all leads are equally valuable.
Marketing Qualified Leads (MQLs) are prospects who have demonstrated sufficient interest to be considered potential customers.
Examples include users who:
- Download multiple resources
- Attend webinars
- Request demos
- Engage repeatedly with content
Why MQLs Matter
Tracking MQLs helps businesses move beyond lead quantity and focus on lead quality.
A campaign generating fewer but highly qualified leads may ultimately produce more revenue than a campaign producing a large volume of low-intent prospects.
Sales Qualified Leads (SQLs)
Sales Qualified Leads have progressed beyond initial interest and are considered ready for direct sales engagement.
These prospects typically meet specific qualification criteria such as:
- Budget availability
- Purchase intent
- Decision-making authority
- Business need
Why SQLs Matter
SQL tracking helps connect social media activity to actual sales opportunities and revenue generation.
Businesses that monitor SQLs gain a clearer understanding of which campaigns attract buyers rather than casual visitors.
Lead-to-Customer Conversion Rate
This KPI measures how many leads ultimately become paying customers.
Formula
Lead-to-Customer Conversion Rate = (Customers Acquired ÷ Total Leads) × 100
This metric provides one of the clearest indicators of social media's contribution to business growth.
A strong lead generation campaign should not only attract leads but also attract leads that convert into customers.
Using Automation to Improve Lead Generation KPIs
As businesses scale their social media efforts, manually tracking lead generation metrics becomes increasingly difficult.
Social media automation platforms like Bibby can help streamline the process by centralizing content scheduling, campaign performance tracking, audience engagement data, and lead attribution insights. Instead of gathering data from multiple platforms, marketing teams can monitor key lead generation KPIs from a single workflow, making optimization faster and more efficient.
Automation also enables businesses to:
- Track campaign performance consistently
- Identify high-converting content
- Monitor lead generation trends
- Improve reporting accuracy
- Reduce manual administrative work
Measuring Lead Generation Effectively
Lead generation KPIs help businesses evaluate whether social media efforts are creating genuine business opportunities rather than simply generating engagement.
When analyzed together, metrics such as lead volume, CPL, conversion rate, MQLs, SQLs, and lead-to-customer conversion rate provide a comprehensive picture of social media's impact on the sales funnel.
These KPIs help answer important questions:
- How many leads does social media generate?
- How much does each lead cost?
- Are leads qualified and sales-ready?
- Which campaigns contribute most to customer acquisition?
For businesses seeking measurable ROI, the next step is connecting these leads directly to sales performance and revenue outcomes.
Also read: How to Grow on Social Media With AI?
Sales and Revenue KPIs That Matter Most
While awareness, engagement, and lead generation metrics are important, most businesses ultimately want to know one thing: is social media contributing to revenue?
Sales and revenue KPIs help answer that question. These metrics connect social media activity to tangible business outcomes, allowing organizations to evaluate the true financial impact of their marketing efforts.
By tracking revenue-focused KPIs, businesses can move beyond vanity metrics and demonstrate how social media supports growth, customer acquisition, and profitability.
Conversion Rate
Conversion rate measures the percentage of users who complete a desired action after interacting with your social media content.
Depending on the business model, conversions may include:
- Product purchases
- Service bookings
- Demo requests
- Free trial signups
- Subscription purchases
- Consultation requests
Conversion Rate Formula
Conversion Rate = (Conversions ÷ Total Visitors) × 100
For example:
- Social media visitors: 2,000
- Conversions: 100
Conversion Rate = 5%
Why Conversion Rate Matters
A strong conversion rate indicates that your audience targeting, content strategy, and landing pages are working effectively together.
This KPI helps businesses identify:
- High-performing campaigns
- Effective offers
- Successful audience segments
- Strong conversion pathways
Even small improvements in conversion rate can have a significant impact on revenue.
Customer Acquisition Cost (CAC)
Customer Acquisition Cost measures how much a business spends to acquire a new customer through social media marketing efforts.
CAC Formula
CAC = Total Social Media Marketing Costs ÷ New Customers Acquired
For example:
- Marketing spend: $10,000
- New customers acquired: 100
CAC = $100 per customer
Why CAC Matters
Customer acquisition cost directly affects profitability.
A business may generate strong sales numbers, but if acquisition costs are too high, profitability suffers.
Tracking CAC helps businesses:
- Evaluate campaign efficiency
- Improve budget allocation
- Compare platform performance
- Scale profitable campaigns
The goal is not necessarily to achieve the lowest CAC but to maintain a sustainable balance between acquisition costs and customer value.
Customer Lifetime Value (CLV)
Customer Lifetime Value estimates the total revenue a customer is expected to generate throughout their relationship with a business.
Why CLV Matters
Customer Lifetime Value provides important context for acquisition spending.
For example:
- CAC: $100
- CLV: $2,000
This relationship suggests that acquiring customers through social media is highly profitable.
Without CLV data, businesses may underestimate the value of successful social media campaigns.
Many organizations monitor CAC and CLV together to assess long-term marketing performance.
Revenue Generated From Social Media
This KPI measures the total revenue directly attributable to social media activities.
Revenue sources may include:
- Organic social traffic
- Paid social campaigns
- Social commerce sales
- Lead generation campaigns
- Influencer partnerships
Why Revenue Attribution Matters
Tracking revenue generated from social media helps businesses:
- Justify marketing investments
- Measure campaign effectiveness
- Identify top-performing channels
- Prioritize profitable strategies
Modern analytics tools allow marketers to connect social interactions with customer purchases across multiple touchpoints.
Also read: How Social Media Automation Helps Startups Grow Faster
Return on Investment (ROI)
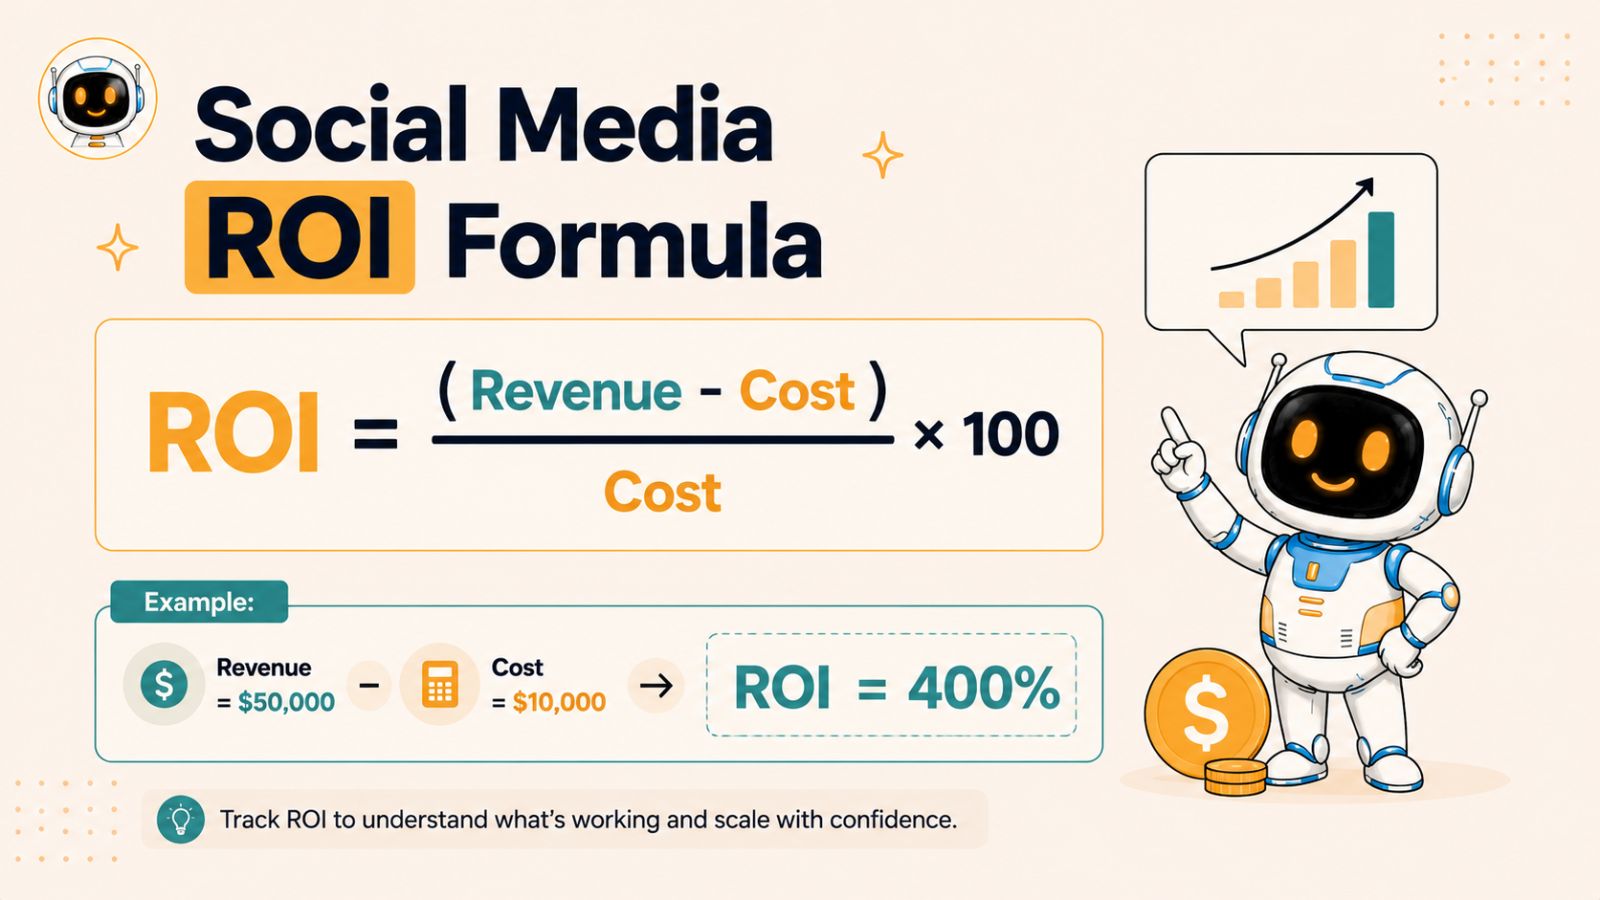
Return on Investment is one of the most important KPIs for executives and business owners because it measures profitability relative to marketing spend.
ROI Formula
ROI = [(Revenue - Cost) ÷ Cost] × 100
For example:
- Revenue generated: $50,000
- Campaign cost: $10,000
ROI = 400%
Why ROI Matters
ROI demonstrates whether social media is creating financial value for the business.
A positive ROI indicates that campaigns are generating more revenue than they cost, while a negative ROI signals a need for optimization.
ROI reporting often becomes the foundation for:
- Budget decisions
- Resource allocation
- Executive reporting
- Long-term marketing strategy
Attribution Models and Revenue Tracking
One challenge businesses face when measuring social media ROI is attribution.
Customers rarely purchase after a single interaction. They may:
- Discover a brand through Instagram.
- Visit the website later through Google.
- Download a guide.
- Receive email follow-ups.
- Make a purchase weeks later.
Attribution models help determine how credit should be assigned across these touchpoints.
Common attribution models include:
- First-touch attribution
- Last-touch attribution
- Linear attribution
- Time-decay attribution
- Multi-touch attribution
Businesses using advanced attribution methods often gain a more accurate understanding of social media's contribution to revenue.
Revenue Per Platform
Not all social networks contribute equally to revenue.
Tracking revenue by platform helps businesses identify where investments generate the strongest returns.
For example:
| Platform | Key Revenue Strength |
|---|---|
| B2B lead generation | |
| Ecommerce and brand-driven purchases | |
| Broad audience acquisition | |
| TikTok | Product discovery and impulse purchases |
| YouTube | Education-driven conversions |
Analyzing platform-level revenue helps marketers focus resources where they have the greatest impact.
Using Automation to Improve Revenue Reporting
As businesses expand across multiple social platforms, revenue reporting can quickly become complex.
Tools like Bibby can simplify performance tracking by consolidating campaign data, engagement metrics, traffic insights, and conversion reporting into a centralized workflow. Rather than manually pulling reports from multiple platforms, marketers can monitor key revenue-related KPIs more efficiently and identify trends faster.
Automation can help businesses:
- Track campaign ROI consistently
- Monitor platform-level performance
- Identify top-converting content
- Reduce reporting time
- Improve decision-making with real-time data
This allows marketing teams to spend less time compiling reports and more time optimizing results.
Measuring Revenue Impact Effectively
Revenue KPIs provide the clearest picture of social media's business value. They connect marketing activities directly to customer acquisition, sales growth, and profitability.
When analyzed together, conversion rate, CAC, CLV, attributed revenue, and ROI help answer critical business questions:
- Is social media generating customers?
- Are acquisition costs sustainable?
- Which platforms produce the highest returns?
- How much revenue can be attributed to social media efforts?
For businesses seeking long-term growth, these metrics transform social media from a marketing expense into a measurable revenue driver.
However, generating revenue is only part of the equation. Retaining customers and providing exceptional customer experiences through social media can be equally valuable, which is why customer service and retention KPIs deserve close attention.
Customer Service and Retention KPIs
Many businesses focus heavily on acquiring new customers through social media, but long-term growth often depends just as much on retaining existing customers. Social media has evolved into a critical customer service channel where consumers ask questions, seek support, share feedback, and engage directly with brands.
Customer service and retention KPIs help businesses measure how effectively they are building relationships, resolving issues, and maintaining customer satisfaction over time.
Response Time
Response time measures how quickly a business replies to customer inquiries, comments, direct messages, or support requests on social media.
Why Response Time Matters
Modern consumers expect fast responses from brands. Delayed responses can lead to:
- Customer frustration
- Lost sales opportunities
- Negative brand perception
- Reduced customer loyalty
Faster response times often contribute to:
- Higher customer satisfaction
- Increased trust
- Better engagement rates
- Stronger customer relationships
While ideal response times vary by industry, businesses should strive to respond as quickly as possible, especially to support-related inquiries.
Response Rate
Response rate measures the percentage of customer inquiries that receive a response.
Response Rate Formula
Response Rate = (Responses Sent ÷ Total Customer Inquiries) × 100
Why Response Rate Matters
A business may respond quickly to some messages but ignore others.
Tracking response rate ensures that customer interactions are handled consistently and helps identify gaps in customer support processes.
A high response rate demonstrates that a business values customer communication and actively participates in conversations.
Resolution Rate
Resolution rate measures the percentage of customer issues successfully resolved through social media channels.
Resolution Rate Formula
Resolution Rate = (Resolved Cases ÷ Total Cases) × 100
Why Resolution Rate Matters
Responding to customers is important, but resolving their problems is what truly drives satisfaction.
A high resolution rate typically indicates:
- Effective support processes
- Well-trained customer service teams
- Strong communication practices
- Positive customer experiences
Businesses should aim to resolve issues efficiently while maintaining a positive customer experience.
Customer Satisfaction Score (CSAT)
Customer Satisfaction Score measures how satisfied customers are following an interaction with a brand.
Many companies collect CSAT feedback through simple surveys asking customers to rate their experience.
Why CSAT Matters
CSAT provides direct insight into customer perceptions and service quality.
High satisfaction scores often correlate with:
- Strong customer retention
- Positive reviews
- Increased referrals
- Greater customer loyalty
Tracking CSAT alongside response and resolution metrics helps businesses evaluate both operational efficiency and customer sentiment.
Brand Sentiment
Brand sentiment measures how customers feel about your business based on social media conversations and mentions.
Sentiment is generally categorized as:
- Positive
- Neutral
- Negative
Why Brand Sentiment Matters
Brand sentiment provides context that quantitative metrics alone cannot offer.
For example:
- Increased mentions may appear positive.
- However, if most mentions are negative, awareness growth could actually signal a reputation problem.
Monitoring sentiment helps businesses:
- Identify emerging issues
- Understand customer perceptions
- Protect brand reputation
- Measure campaign impact
A positive sentiment trend often indicates healthy customer relationships and strong brand trust.
Customer Retention Rate
Customer retention rate measures the percentage of customers who continue doing business with a company over a specific period.
Although retention data often comes from CRM or sales systems, social media can play an important role in influencing retention outcomes.
Why Retention Matters
Retaining existing customers is typically less expensive than acquiring new ones.
Higher retention rates often lead to:
- Increased profitability
- Greater customer lifetime value
- Stronger brand advocacy
- More predictable revenue
Businesses that use social media to educate, support, and engage customers frequently see stronger retention performance.
Repeat Purchase Rate
For ecommerce and subscription-based businesses, repeat purchase rate is a valuable retention KPI.
Formula
Repeat Purchase Rate = (Returning Customers ÷ Total Customers) × 100
Why It Matters
Social media can nurture customer relationships through:
- Educational content
- Product updates
- Community engagement
- Customer success stories
- Loyalty campaigns
These activities encourage repeat purchases and strengthen long-term customer relationships.
Net Promoter Score (NPS)
Net Promoter Score measures customer loyalty by asking a simple question:
"How likely are you to recommend our business to others?"
Based on their responses, customers are classified as:
- Promoters
- Passives
- Detractors
Why NPS Matters
NPS helps businesses understand how customers perceive their brand and whether they are likely to generate word-of-mouth referrals.
Strong NPS scores often indicate:
- High customer satisfaction
- Strong loyalty
- Positive brand experiences
- Sustainable growth potential
Using Automation to Improve Customer Service KPIs
As businesses grow, managing customer interactions across multiple social media platforms becomes increasingly challenging.
Social media automation platforms like Bibby can help teams centralize messages, monitor engagement activity, schedule content, and maintain more consistent customer communication. By reducing manual tasks and streamlining workflows, businesses can respond faster and ensure important customer interactions don't get overlooked.
Automation can support customer service efforts by helping teams:
- Monitor conversations across platforms
- Track engagement activity in one place
- Improve response consistency
- Reduce administrative workload
- Generate performance reports more efficiently
While automation improves efficiency, businesses should still maintain a human touch when handling customer questions, complaints, and sensitive interactions.
Measuring Customer Relationships Effectively
Customer service and retention KPIs provide valuable insights into the long-term health of a business. While acquisition metrics focus on attracting customers, retention metrics reveal whether customers continue to find value after the initial interaction.
When analyzed together, response time, response rate, resolution rate, CSAT, sentiment, retention rate, repeat purchases, and NPS help answer critical questions:
- Are customers satisfied with their experience?
- How effectively are issues being resolved?
- Is customer loyalty increasing over time?
- How does social media contribute to retention?
Businesses that consistently monitor these KPIs can strengthen customer relationships, improve brand reputation, and maximize the lifetime value of their audience.
While these KPIs apply broadly across social media, each platform offers unique opportunities and performance indicators. Understanding platform-specific KPIs can help businesses optimize their strategy even further.
Platform-Specific Social Media KPIs
While many social media KPIs apply across all platforms, each network has unique features, user behaviors, and content formats that influence performance measurement. A KPI that is highly valuable on LinkedIn may be less relevant on TikTok, while Instagram and YouTube often prioritize entirely different engagement signals.
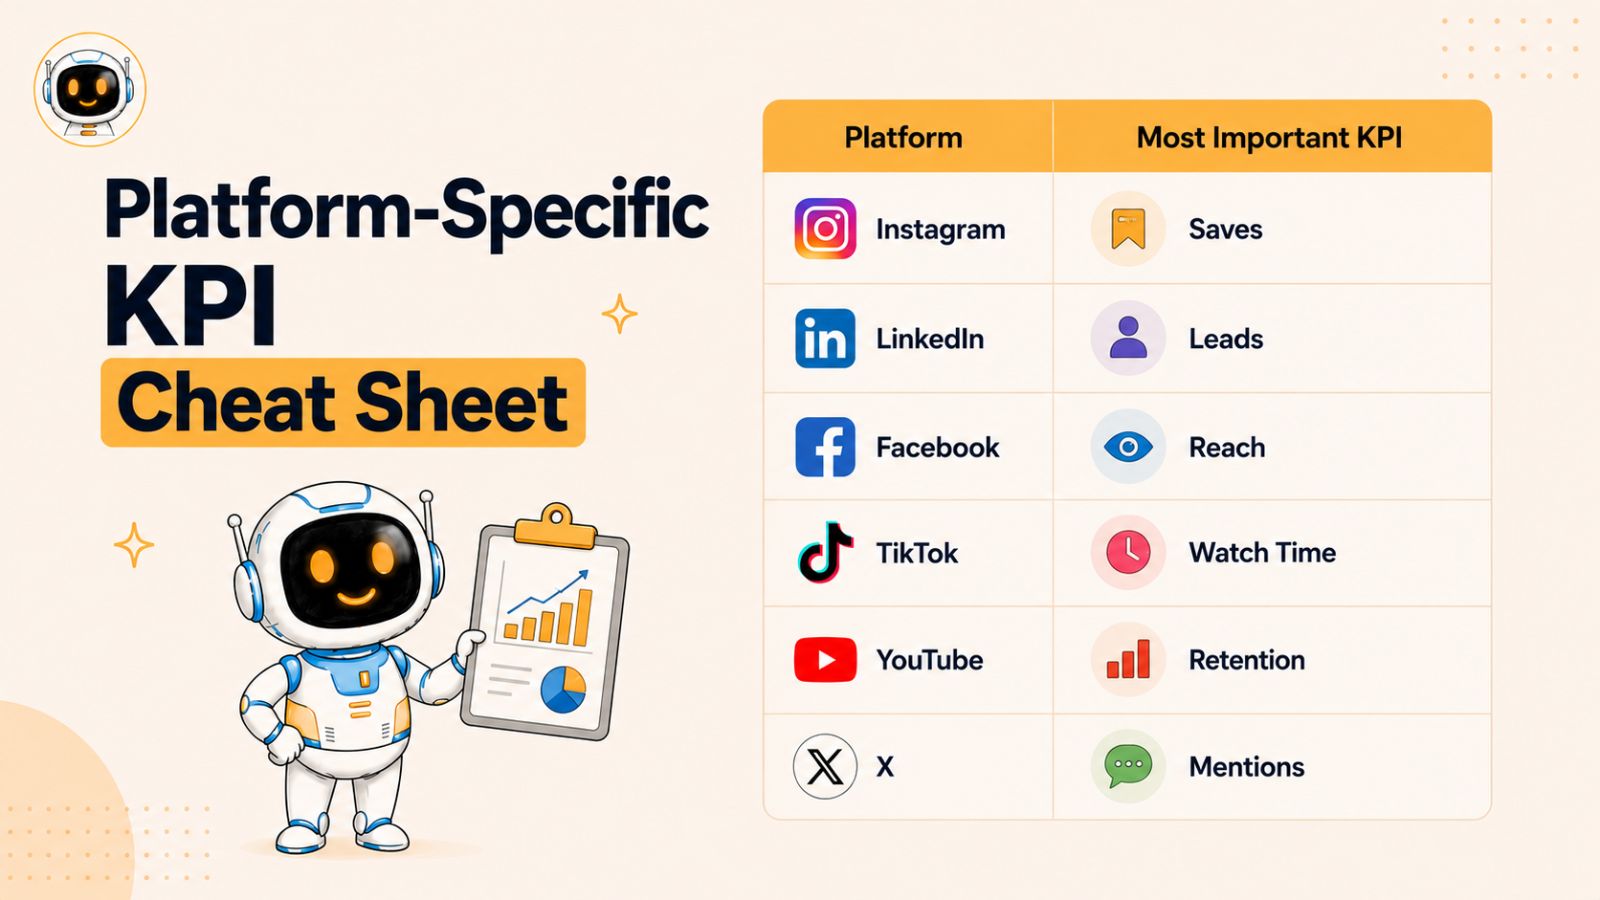
Understanding platform-specific KPIs helps businesses evaluate performance more accurately and optimize their content strategy for each channel.
Facebook KPIs
Facebook remains one of the largest social platforms for community building, advertising, and customer engagement.
Key Facebook KPIs to Track
Reach
Measures the number of unique users who see your content.
Engagement Rate
Tracks likes, comments, shares, and reactions relative to reach or impressions.
Link Clicks
Measures traffic-driving actions from posts and advertisements.
Video Views
Evaluates video content performance and audience interest.
Page Follower Growth
Tracks audience expansion over time.
Why These KPIs Matter
Facebook's algorithm rewards content that generates meaningful interactions. Businesses should prioritize engagement quality alongside audience growth and traffic generation.
Instagram KPIs
Instagram continues to be a leading platform for brand building, visual storytelling, and influencer marketing.
Key Instagram KPIs to Track
Reach
Measures how many unique users discover your content.
Engagement Rate
Includes likes, comments, shares, and saves.
Saves
One of Instagram's strongest content-quality signals.
Story Completion Rate
Measures how many users watch an entire story sequence.
Reels Watch Time
Tracks audience retention and video engagement.
Profile Visits
Indicates growing interest in your brand.
Why These KPIs Matter
Instagram increasingly rewards content that keeps users engaged. Saves, shares, and watch time often provide stronger performance signals than likes alone.
LinkedIn KPIs
LinkedIn is particularly valuable for B2B marketing, professional networking, and lead generation.
Key LinkedIn KPIs to Track
Engagement Rate
Measures interactions with posts, articles, and company updates.
Profile Views
Indicates growing brand awareness and professional interest.
Lead Generation Form Submissions
Tracks lead capture performance from LinkedIn campaigns.
Website Clicks
Measures traffic generated from LinkedIn content.
Follower Growth
Monitors audience expansion within target industries.
Why These KPIs Matter
LinkedIn users are often further along the buying journey than audiences on other platforms. As a result, lead quality frequently matters more than engagement volume.
X (Twitter) KPIs
X remains an important platform for real-time conversations, thought leadership, and customer engagement.
Key X KPIs to Track
Impressions
Measures content visibility.
Engagement Rate
Tracks interactions relative to post views.
Mentions
Indicates audience participation and brand awareness.
Link Clicks
Measures traffic generation performance.
Follower Growth Rate
Evaluates audience expansion over time.
Why These KPIs Matter
Success on X often depends on visibility, conversation participation, and timely engagement with industry trends.
TikTok KPIs
TikTok has become one of the most powerful platforms for organic reach and content discovery.
Key TikTok KPIs to Track
Video Views
Measures content exposure.
Watch Time
Tracks how long users stay engaged with videos.
Completion Rate
Measures the percentage of viewers who watch a video until the end.
Shares
Indicates content value and viral potential.
Follower Growth
Tracks audience expansion.
Why These KPIs Matter
TikTok's algorithm places significant emphasis on watch time, completion rate, and engagement signals. These metrics often have a direct impact on content distribution.
YouTube KPIs
YouTube remains one of the strongest platforms for long-form content, education, and search-driven traffic.
Key YouTube KPIs to Track
Watch Time
One of the platform's most important ranking signals.
Audience Retention
Measures how effectively videos keep viewers engaged.
Subscriber Growth
Tracks channel expansion.
Click-Through Rate (CTR)
Evaluates thumbnail and title effectiveness.
Revenue Metrics
Important for businesses monetizing content or generating leads through video.
Why These KPIs Matter
YouTube rewards content that keeps viewers on the platform longer. Watch time and retention often provide more meaningful insights than view count alone.
Choosing the Right KPIs for Each Platform
Businesses often make the mistake of measuring every platform using identical KPIs. While consistency is important, each channel serves a different purpose.
For example:
| Platform | Primary KPI Focus |
|---|---|
| Reach, engagement, traffic | |
| Saves, shares, reach, reels engagement | |
| Lead generation, website clicks, professional engagement | |
| X (Twitter) | Mentions, engagement, visibility |
| TikTok | Watch time, completion rate, shares |
| YouTube | Watch time, retention, conversions |
Aligning KPIs with platform-specific behaviors helps businesses gain more meaningful insights and make better optimization decisions.
Managing Platform Data Efficiently
One challenge for growing businesses is tracking performance across multiple platforms simultaneously. Gathering reports from Facebook, Instagram, LinkedIn, TikTok, YouTube, and other channels can quickly become time-consuming.
Social media automation tools like Bibby help streamline this process by bringing content management, scheduling, performance monitoring, and reporting into a unified workflow. Instead of switching between multiple analytics dashboards, teams can monitor key KPIs more efficiently and identify trends across platforms.
This approach helps marketers:
- Save time on reporting
- Maintain consistent performance tracking
- Compare platform performance more easily
- Identify top-performing content faster
- Make data-driven decisions at scale
Measuring Platform Performance Effectively
Platform-specific KPIs provide the detailed insights businesses need to optimize their social media strategy. Rather than relying on generic metrics, marketers can focus on the indicators that matter most for each channel.
These KPIs help answer important questions:
- Which platforms deliver the strongest results?
- What content formats perform best on each channel?
- Where should marketing resources be allocated?
- Which KPIs have the greatest impact on business goals?
However, tracking dozens of metrics across multiple platforms can quickly become overwhelming. The most effective solution is creating a centralized KPI dashboard that organizes critical data into a single, easy-to-understand view.
How to Build a Social Media KPI Dashboard
Tracking social media KPIs is only valuable if the data can be easily understood and acted upon. Without a centralized reporting system, businesses often spend more time collecting data than analyzing it.
A social media KPI dashboard solves this problem by bringing critical performance metrics into a single view. Instead of switching between multiple platforms and spreadsheets, teams can monitor progress, identify trends, and make data-driven decisions more efficiently.
Whether you're a small business owner, marketing manager, or agency, a well-designed dashboard can significantly improve reporting accuracy and strategic planning.
Why Every Business Needs a KPI Dashboard
Social media generates large amounts of data every day. Without proper organization, important insights can easily be overlooked.
A KPI dashboard helps businesses:
- Monitor performance in real time
- Identify opportunities and problems quickly
- Align marketing efforts with business goals
- Improve decision-making
- Reduce manual reporting work
- Communicate results to stakeholders
Most importantly, dashboards transform raw data into actionable insights.
Step 1: Start With Business Objectives
Before selecting metrics, identify the primary business goals your social media strategy supports.
Common objectives include:
Brand Awareness
Track:
- Reach
- Impressions
- Audience growth rate
- Brand mentions
Engagement
Track:
- Engagement rate
- Comments
- Shares
- Saves
- Video interactions
Website Traffic
Track:
- Click-through rate (CTR)
- Link clicks
- Social referral traffic
- Bounce rate
Lead Generation
Track:
- Lead volume
- Cost per lead
- Lead conversion rate
- Marketing qualified leads
Revenue Growth
Track:
- Conversion rate
- Customer acquisition cost
- Revenue attribution
- ROI
The best dashboards focus on metrics that directly support business outcomes rather than tracking every available data point.
Step 2: Organize KPIs by Funnel Stage
A useful dashboard structure follows the customer journey.
Top of Funnel (Awareness)
Metrics include:
- Reach
- Impressions
- Follower growth
- Share of voice
Middle of Funnel (Engagement)
Metrics include:
- Engagement rate
- Comments
- Shares
- Saves
- Video watch time
Bottom of Funnel (Conversion)
Metrics include:
- Lead volume
- Conversion rate
- Customer acquisition cost
- Revenue
- ROI
This framework makes it easier to identify where performance bottlenecks occur.
For example:
- Strong awareness but weak engagement may indicate content relevance issues.
- Strong engagement but low conversions may signal landing page problems.
- High conversion rates but low traffic may suggest a need for greater visibility.
Step 3: Focus on Actionable Metrics
One of the biggest dashboard mistakes is including too many metrics.
A dashboard overloaded with data can make reporting more confusing rather than more useful.
Instead, prioritize KPIs that answer important business questions such as:
- Are more people discovering our brand?
- Is audience engagement improving?
- Are social campaigns generating leads?
- Is social media producing revenue?
- Which platforms deliver the best ROI?
If a metric doesn't support decision-making, it likely doesn't belong on the dashboard.
Step 4: Create Reporting Benchmarks
KPIs become more valuable when compared against benchmarks.
Businesses should track:
- Month-over-month performance
- Quarter-over-quarter growth
- Year-over-year trends
- Industry benchmarks
- Internal targets
Benchmarking helps teams understand whether performance is genuinely improving or simply fluctuating.
Step 5: Automate Data Collection
Manual reporting is one of the biggest productivity drains for marketing teams.
Gathering data from Facebook, Instagram, LinkedIn, TikTok, YouTube, analytics platforms, and spreadsheets can consume hours each week.
This is where social media automation becomes especially valuable.
Platforms like Bibby can help businesses streamline content management, scheduling, performance monitoring, and reporting by reducing the need to manually collect data from multiple sources. Instead of spending valuable time compiling reports, marketers can focus on analyzing results and improving campaigns.
Automation offers several advantages:
- Faster reporting
- Consistent KPI tracking
- Reduced human error
- Better visibility across channels
- More time for strategy and optimization
For growing businesses, automation often becomes essential as social media activity scales.
Step 6: Establish Reporting Frequency
Not every KPI requires daily monitoring.
Different metrics should be reviewed at different intervals.
Daily Monitoring
Track:
- Engagement activity
- Comments and messages
- Campaign performance
- Customer service metrics
Weekly Reporting
Track:
- Traffic metrics
- Content performance
- Audience growth
- Lead generation
Monthly Reporting
Track:
- ROI
- Revenue attribution
- Customer acquisition cost
- Strategic performance trends
Establishing a consistent reporting cadence helps teams stay proactive rather than reactive.
Example Social Media KPI Dashboard Structure
A practical dashboard may include:
| Category | Core KPIs |
|---|---|
| Awareness | Reach, impressions, audience growth |
| Engagement | Engagement rate, shares, saves, comments |
| Traffic | CTR, referral traffic, bounce rate |
| Leads | Lead volume, CPL, conversion rate |
| Revenue | CAC, revenue attribution, ROI |
| Customer Service | Response time, CSAT, sentiment |
This structure provides a balanced view of the entire social media funnel.
Common Dashboard Mistakes to Avoid
Tracking Too Many KPIs
Focus on metrics that align with business goals.
Reporting Without Context
Always compare performance against benchmarks and targets.
Ignoring Revenue Metrics
Engagement is valuable, but revenue impact ultimately matters.
Using Separate Reporting Systems
Fragmented reporting creates inefficiencies and increases the risk of inaccurate data.
Failing to Act on Insights
A dashboard is only useful if the data influences decision-making and optimization efforts.
Building a Dashboard That Drives Results
A social media KPI dashboard should do more than display numbers. It should help businesses understand what's working, identify opportunities for improvement, and guide strategic decisions.
When built correctly, dashboards provide visibility across the entire customer journey—from awareness and engagement to lead generation, customer acquisition, and revenue growth.
As businesses mature their reporting processes, the next challenge becomes understanding how their performance compares to competitors and industry standards. That's where social media KPI benchmarks become invaluable.
Social Media KPI Benchmarks and Industry Standards
Tracking social media KPIs without context can lead to misleading conclusions. A 3% engagement rate may be exceptional in one industry but below average in another. Similarly, a campaign that generates 500 leads might be considered successful for a niche B2B company but underperforming for a large ecommerce brand.
This is why benchmarks are important. Social media KPI benchmarks provide a point of reference that helps businesses evaluate performance, set realistic goals, and identify opportunities for improvement.
Why KPI Benchmarks Matter
Benchmarks help answer questions such as:
- Is our engagement rate competitive?
- Are we growing faster than similar brands?
- Is our cost per lead reasonable?
- How does our conversion rate compare to industry standards?
Without benchmarks, businesses risk either celebrating weak performance or setting unrealistic expectations.
Benchmarking provides the context needed to make smarter decisions and prioritize optimization efforts.
Awareness KPI Benchmarks
Awareness metrics help businesses evaluate brand visibility and audience growth.
Reach Growth
Rather than focusing on a specific reach number, businesses should monitor consistent month-over-month growth.
Healthy indicators include:
- Increasing reach over time
- Expanding audience segments
- Growth across multiple platforms
- Improved content distribution
Audience Growth Rate
Smaller accounts often experience faster growth rates than larger, more established brands.
When evaluating growth:
- Compare current growth to historical performance.
- Measure growth against competitors.
- Track trends over several months rather than isolated periods.
Sustainable growth is often more valuable than sudden spikes caused by short-term campaigns.
Engagement KPI Benchmarks
Engagement benchmarks vary significantly by platform, audience size, and industry.
Engagement Rate
Generally speaking:
| Engagement Rate | Performance Level |
|---|---|
| Under 1% | Below average |
| 1%–3% | Average |
| 3%–6% | Strong |
| Above 6% | Excellent |
These figures should be used as directional guidelines rather than strict rules.
Shares and Saves
High-performing content often generates:
- More shares than promotional posts
- More saves than purely entertaining content
- Higher engagement from niche audiences
For many businesses, shares and saves provide stronger indicators of content value than likes.
Traffic KPI Benchmarks
Traffic metrics help evaluate how effectively social media drives users to owned channels.
Click-Through Rate (CTR)
CTR varies depending on platform, audience, and content type.
Businesses should focus on:
- Consistent improvement over time
- Comparing content formats
- Identifying top-performing campaigns
Rather than chasing arbitrary industry averages, focus on improving your own baseline performance.
Bounce Rate
A lower bounce rate generally indicates better traffic quality.
However, acceptable bounce rates depend on:
- Website type
- Landing page design
- User intent
- Content format
Traffic quality metrics should always be analyzed together rather than in isolation.
Lead Generation KPI Benchmarks
Lead generation performance depends heavily on industry, offer quality, and audience targeting.
Cost Per Lead (CPL)
Acceptable CPL varies dramatically between industries.
For example:
- B2B software companies often tolerate higher CPLs.
- Local service businesses may require lower acquisition costs.
- Enterprise-focused organizations typically invest more per lead.
The most important benchmark is whether lead acquisition remains profitable.
Lead Conversion Rate
Businesses should monitor:
- Conversion rate trends
- Landing page performance
- Campaign-level comparisons
- Lead quality metrics
Continuous improvement is often more valuable than matching a generic industry average.
Revenue KPI Benchmarks
Revenue metrics provide the clearest measure of social media effectiveness.
Customer Acquisition Cost (CAC)
CAC should always be evaluated alongside Customer Lifetime Value (CLV).
A higher CAC may be acceptable if:
- Customers remain loyal
- Average order values are strong
- Customer lifetime value is high
Positive ROI remains the ultimate benchmark.
Businesses should focus on:
- Improving profitability over time
- Identifying high-performing campaigns
- Scaling successful strategies
A campaign with lower engagement but higher ROI is typically more valuable than one with strong engagement and weak revenue performance.
Factors That Influence KPI Benchmarks
No benchmark exists in a vacuum.
Performance is affected by numerous factors, including:
Industry
A software company, restaurant, ecommerce store, and professional services firm will all have different KPI expectations.
Audience Size
Smaller audiences often generate higher engagement rates because relationships are more personal and communities are more focused.
Platform
Engagement behaviors vary significantly across Facebook, Instagram, LinkedIn, TikTok, YouTube, and X.
Content Format
Videos, carousels, stories, articles, and static images often produce very different results.
Campaign Objective
Brand awareness campaigns should not be judged using the same benchmarks as lead generation or sales campaigns.
Creating Internal Benchmarks
While industry benchmarks are useful, internal benchmarks are often even more valuable.
Businesses should establish performance baselines by tracking:
- Previous campaign results
- Monthly performance trends
- Quarterly growth rates
- Year-over-year improvements
Internal benchmarks provide a more accurate picture of progress because they reflect your unique audience, industry, and goals.
Using Data to Continuously Improve Performance
The most successful businesses don't use benchmarks as fixed targets. Instead, they use them as a starting point for ongoing optimization.
Tools like Bibby can help teams track KPI trends consistently across multiple platforms, making it easier to compare performance over time and identify meaningful improvements. By centralizing reporting and performance data, businesses can establish stronger internal benchmarks and make more informed decisions.
The goal is not simply to match industry averages. The goal is to outperform your previous results, improve efficiency, and create measurable business growth.
Benchmarking for Smarter Decision-Making
Social media KPI benchmarks provide valuable context that transforms raw numbers into actionable insights. They help businesses understand whether performance is improving, identify areas for optimization, and set realistic goals for future campaigns.
When combined with consistent reporting and performance tracking, benchmarks help answer critical questions:
- Are our KPIs improving?
- How do we compare to competitors?
- Which areas need attention?
- Are our campaigns delivering meaningful business results?
Even with strong KPI tracking and benchmarking practices, many businesses still struggle to generate actionable insights because they make common measurement mistakes. Avoiding these pitfalls is essential for maximizing the value of social media analytics.
Future Trends in Social Media Measurement
Social media analytics has evolved significantly over the past decade, and the way businesses measure performance continues to change. As platforms introduce new features, privacy regulations become stricter, and artificial intelligence becomes more sophisticated, marketers must adapt their measurement strategies to remain competitive.
Understanding emerging trends can help businesses build more resilient KPI frameworks and make better long-term decisions.
AI-Powered Analytics and Reporting
Artificial intelligence is transforming how marketers analyze social media performance.
Instead of manually reviewing reports and spreadsheets, AI-powered analytics tools can identify patterns, detect anomalies, and surface actionable insights automatically.
AI-driven reporting can help businesses:
- Identify top-performing content faster
- Predict engagement trends
- Detect audience behavior changes
- Recommend content optimizations
- Generate performance summaries automatically
As AI capabilities improve, marketers will spend less time collecting data and more time acting on insights.
For businesses managing multiple social channels, platforms like Bibby can play an increasingly important role by combining automation, content management, and performance monitoring into a streamlined workflow that reduces reporting complexity.
Predictive Performance Metrics
Traditionally, social media KPIs have focused on historical performance.
Future analytics systems will increasingly emphasize predictive insights.
Rather than simply answering:
"What happened?"
Businesses will gain answers to questions such as:
- Which content is most likely to perform well?
- Which campaigns are likely to generate conversions?
- When is audience engagement expected to peak?
- Which customer segments show the highest purchase intent?
Predictive analytics can help marketers allocate resources more effectively and make proactive decisions.
First-Party Data Will Become More Important
Privacy regulations and platform changes are reducing access to some forms of third-party tracking data.
As a result, businesses are placing greater emphasis on first-party data collected directly from their audiences.
Examples include:
- Email subscribers
- Customer databases
- CRM records
- Website behavior data
- Loyalty program information
By combining social media KPIs with first-party data, businesses can develop a more complete understanding of the customer journey while maintaining compliance with evolving privacy standards.
Multi-Touch Attribution Will Become the Standard
Modern customers rarely convert after a single interaction.
A typical journey may involve:
- Discovering a brand through social media.
- Visiting the website.
- Reading blog content.
- Joining an email list.
- Returning through a search engine.
- Completing a purchase.
Because of this complexity, businesses are increasingly adopting multi-touch attribution models that distribute credit across multiple touchpoints rather than assigning all value to a single interaction.
This approach provides a more accurate understanding of how social media contributes to business outcomes.
Social Commerce Metrics Will Continue to Grow
As social commerce expands, businesses will increasingly track KPIs directly tied to in-platform purchasing behavior.
Important social commerce metrics may include:
- Product page views
- Add-to-cart rates
- Checkout completion rates
- Social commerce revenue
- Average order value
For brands selling products online, these metrics will become just as important as traditional engagement and traffic KPIs.
Video Analytics Will Become More Sophisticated
Video already dominates social media consumption, and future measurement frameworks will place even greater emphasis on video performance.
Businesses will increasingly focus on:
- Audience retention
- Watch time
- Completion rates
- Rewatch rates
- Engagement by video segment
These insights will help marketers understand not only whether people watch content, but also why they continue watching—or stop watching.
Real-Time Performance Monitoring
Marketing teams are moving away from static monthly reports and toward real-time decision-making.
Modern analytics platforms allow businesses to monitor KPI performance continuously and react more quickly to changes.
Benefits include:
- Faster campaign optimization
- Improved budget allocation
- Earlier issue detection
- Better audience responsiveness
Real-time visibility enables businesses to capitalize on opportunities while they are still relevant.
Unified Marketing Measurement
One of the biggest challenges marketers face is fragmented data.
Social media performance often exists separately from:
- Website analytics
- Email marketing data
- CRM systems
- Advertising platforms
- Sales reporting
The future of social media measurement lies in unified reporting systems that connect these data sources into a single view of customer behavior and business performance.
Solutions that centralize content management, campaign tracking, scheduling, and analytics—such as Bibby—can help businesses move toward a more integrated measurement approach and reduce reliance on disconnected reporting processes.
Preparing for the Future of Social Media Analytics
The fundamentals of social media measurement will remain the same: businesses must track the KPIs that align with their goals and use data to improve performance.
However, the tools, technologies, and methodologies used to collect and analyze that data will continue to evolve.
Organizations that embrace automation, AI-powered insights, predictive analytics, first-party data strategies, and unified reporting systems will be better positioned to make smarter decisions and achieve stronger results.
As social media becomes increasingly tied to revenue generation, customer experience, and business growth, the ability to measure performance accurately will become a significant competitive advantage.
Conclusion
Social media success is no longer measured by follower counts and likes alone. Businesses that consistently track the right KPIs gain a clearer understanding of how their social media efforts contribute to brand awareness, audience engagement, lead generation, customer retention, and revenue growth.
The most important takeaway is that effective social media measurement starts with aligning KPIs to business goals, monitoring performance across the entire customer journey, and using data to drive continuous improvement. By focusing on meaningful metrics instead of vanity metrics, businesses can make smarter decisions, optimize campaigns more effectively, and maximize their return on investment.
As your social media strategy grows, managing content, campaigns, analytics, and reporting across multiple platforms can become increasingly complex. This is where automation and centralized performance tracking can help streamline workflows, improve visibility, and save valuable time.
The next step is to build a social media reporting system that not only tracks your KPIs but also helps you act on them. Whether you're managing a single brand or multiple social channels, creating a structured analytics framework will make it easier to identify opportunities, improve performance, and scale your social media marketing efforts with confidence.