

For example, if your brand accounts for 30% of all relevant brand mentions tracked across a market, your Share of Voice is 30%.
Share of Voice is commonly used in social media, advertising, search, public relations, and competitive analysis. Depending on the channel, SOV can be calculated using brand mentions, impressions, reach, media coverage, advertising visibility, or search visibility. Compare the same type of visibility across your brand and competitors over the same period.
For social media marketers, SOV can show whether your brand is becoming more prominent in the conversations that matter. Tracking it over time can help you read the impact of campaigns, content, launches, and competitor activity. A higher Share of Voice does not automatically mean higher sales or market share. It measures relative visibility, not revenue.
The basic formula is:
Share of Voice = Your Brand's Visibility ÷ Total Market Visibility × 100
Mention tracking and SOV scoring happen in listening or analytics tools—not in Bibby. Bibby is for creating, captioning, and scheduling the next posts once you know where you stand.
What Is Share of Voice?
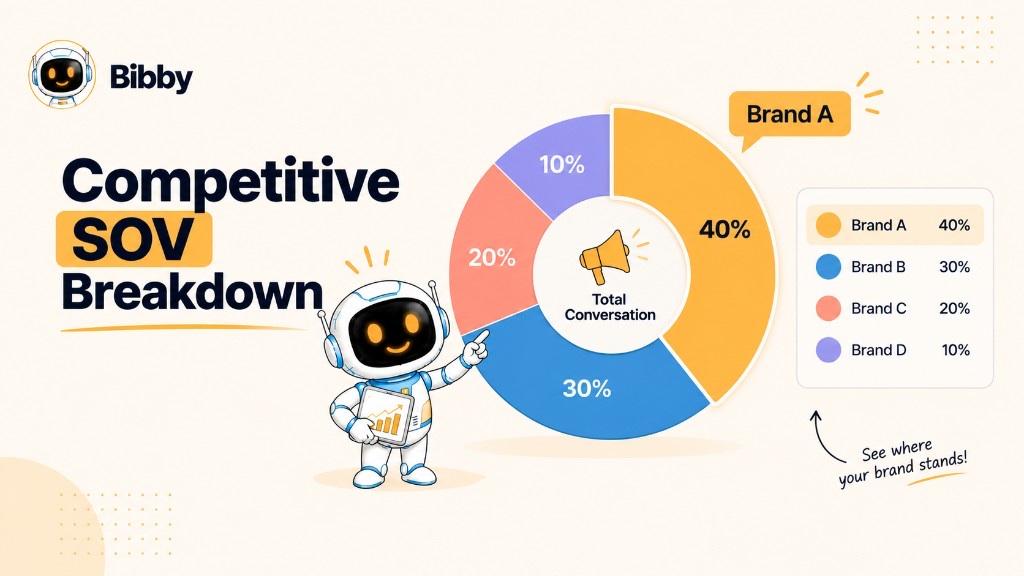
Share of Voice (SOV) is the percentage of total visibility or conversation in a particular market that belongs to your brand compared with competing brands. It is a relative metric: it only makes sense when you define the market, audience, competitors, channel, and time period.
Imagine 10,000 relevant conversations, mentions, or visibility opportunities. If your brand accounts for 2,500 of them, your Share of Voice is 25%. The remaining 75% belongs to the other brands in the measurement.
That is why SOV is useful for competitive analysis. Instead of looking only at your own dashboard, you see how much attention you capture relative to brands competing for the same audience.
What Does “Voice” Mean in Share of Voice?
“Voice” is not spoken words. It is the measurable presence a brand has in a market or channel.
What counts depends on what you measure:
- Social media SOV: Relevant brand mentions or conversations
- Advertising SOV: A brand's share of advertising visibility
- Search SOV: Visibility across a selected group of queries
- PR SOV: A brand's share of relevant media coverage
- Content SOV: Visibility in conversations or content around a topic
A brand can have high SOV on one channel and much lower SOV on another.
Why Is Share of Voice a Relative Metric?
Your SOV depends on the total measurable visibility in the set.
Suppose you generate 1,000 relevant social mentions in a month. If competitors collectively generate 9,000, you are 10% of the measured conversation. The next month you still generate 1,000 mentions, but competitors generate only 4,000. Your SOV rises to 20% even though your own count did not change.
Your individual analytics can look stable while your competitive position improves or declines.
What Can Share of Voice Tell You?
SOV can help answer:
- How visible are we compared with competitors?
- Are we gaining or losing attention in the category?
- Which competitors dominate the conversation?
- Did a campaign increase our relative visibility?
- Which topics or platforms show the strongest presence?
- Is competitive visibility changing over time?
It is not a complete score of marketing success. A brand can generate substantial visibility without meaningful engagement, positive sentiment, leads, or sales. Analyze SOV alongside reach, impressions, engagement, sentiment, conversions, and market share.
A Simple Share of Voice Example
| Brand | Relevant Mentions | Share of Voice |
|---|---|---|
| Brand A | 4,000 | 40% |
| Brand B | 3,000 | 30% |
| Brand C | 2,000 | 20% |
| Brand D | 1,000 | 10% |
| Total | 10,000 | 100% |
Brand A has 40% of the measured conversation among these brands. That is not 40% of the market, customers, or revenue. It is 40% of the specific visibility being measured.
What Does Share of Voice Mean in Marketing?
In marketing, SOV is the proportion of attention or visibility a brand receives in a defined market compared with competitors. It shows how prominently the brand appears where people discover, discuss, and evaluate products.
A social team might use mentions. An advertising team might use exposure. A PR team might use coverage. A search team might use keyword visibility. The principle stays the same: your presence ÷ total competitive presence.
Share of Voice in Social Media
Social SOV is your portion of relevant conversations or mentions versus competing brands.
If a product-category conversation has 20,000 relevant mentions and 5,000 are yours, social SOV is 25%. That can show who dominates the category, whether a campaign moved visibility, which platforms generate conversation, and whether you are rising or falling.
A mention, impression, view, and engagement are different measurements. Do not treat them as interchangeable.
Share of Voice in Advertising
Advertising SOV is a brand's relative share of advertising visibility. Teams may use impressions, placements, estimated exposure, spend, search ads, or broadcast presence—depending on the data source.
If competing brands generate 10 million measured ad impressions and you generate 2 million, advertising SOV is 20%. This can show how aggressively competitors invest in paid visibility. Bibby does not run ads or report advertising SOV.
Share of Voice in Search
Search SOV measures visibility across a defined query set compared with competitors. An SEO team might watch 500 commercial keywords and compare site visibility. Distinguish this from raw search volume, rankings, and Share of Search—related ideas that are not identical.
Share of Voice in Public Relations
PR SOV uses relevant media mentions, articles, news coverage, or campaign coverage. If you receive 150 relevant mentions and the set receives 600, media SOV is 25%. That is especially useful around launches, events, or reputation work.
Brand Share of Voice
Brand Share of Voice is the broader idea of attention in the category. You might have strong social visibility, moderate search visibility, low media coverage, and high advertising visibility. Look at those separately unless the data is genuinely comparable.
Why the Measurement Method Matters
There is no single universal SOV dataset. Two marketers can calculate different percentages because they use different competitor sets, platforms, keywords, periods, geographies, audiences, metrics, or tools.
“Our brand has 35% SOV” is incomplete. “Our brand generated 35% of relevant social mentions among five competitors in the U.S. during August” is usable.
How Does Share of Voice Work?
SOV compares your visibility with total measurable visibility in a defined competitive market.
Define the market → Define the competitors → Measure visibility → Calculate your percentage
1. Define the Market
Limit by industry, geography, audience, language, platforms, queries, topics, campaign, and time. “Share of Voice for our brand” is too vague. Skincare brands on social media in the U.S. during September is a measurement you can repeat.
2. Define the Competitive Set
Include direct competitors, category brands, emerging players, or selected leaders. Three competitors will produce a different percentage than twenty. Keep the set stable when you track over time.
3. Measure Visibility
Examples:
- Social: Mentions, posts, conversations, reach, or impressions
- Advertising: Impressions, placements, or defined exposure
- Search: Visibility across a keyword set
- PR: Relevant coverage
- Content: Topic-level visibility
10,000 mentions and 10 million impressions cannot be dumped into one SOV. Use a consistent denominator.
4. Calculate Your Percentage
Your Brand's Visibility ÷ Total Market Visibility × 100
Your brand 2,000 + A 3,000 + B 3,000 + C 2,000 = 10,000. Your SOV is 20%.
Share of Voice Changes When the Landscape Changes
If you stay at 2,000 mentions while the market grows from 8,000 to 12,000, SOV falls from 25% to about 16.7%. You did not shrink; competitors captured more of the whole. The opposite happens if competitors go quiet: 2,000 of 7,000 is about 28.6%.
Always read SOV next to absolute mentions, reach, impressions, engagement, and conversions.
Track It Over Time
A snapshot is a snapshot. 18% → 21% → 24% → 29% may mean you are capturing more attention—or a campaign, viral post, competitor inactivity, or a method change. The metric shows what changed. You still need why.
The Key Principle
The competitive conversation is 100%. You own one slice. The goal is rarely 100% SOV. The goal is to understand relative competitive visibility and where you are gaining or losing ground.
Share of Voice Formula
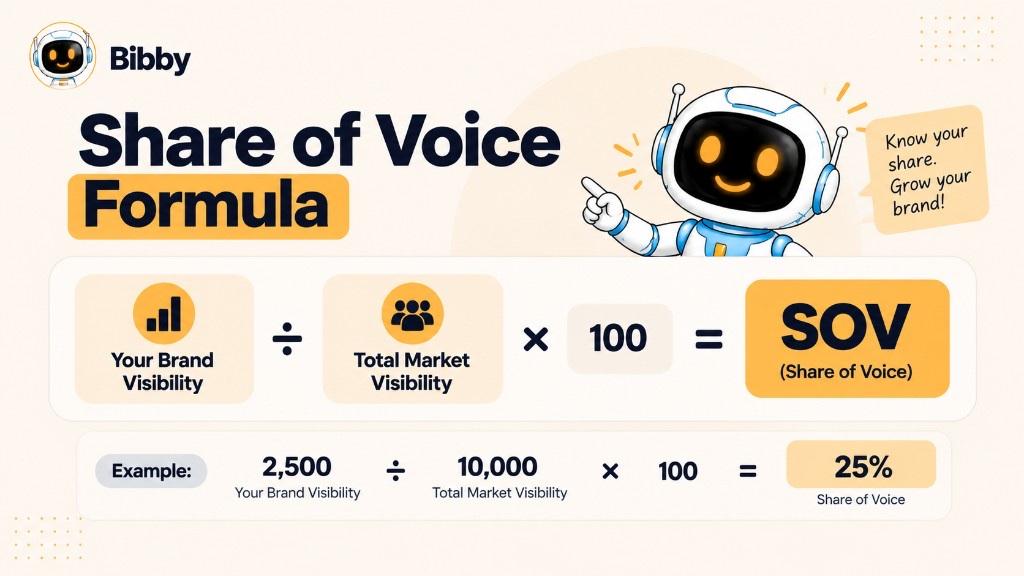
SOV = (Your Brand's Visibility ÷ Total Market Visibility) × 100
- Your Brand's Visibility: Mentions, impressions, coverage, or another chosen metric
- Total Market Visibility: You plus the competitors in the set
- × 100: Converts the proportion to a percentage
Share of Voice Calculation Example
| Brand | Relevant Mentions |
|---|---|
| Your Brand | 2,500 |
| Competitor A | 3,000 |
| Competitor B | 2,000 |
| Competitor C | 2,500 |
| Total | 10,000 |
SOV = (2,500 ÷ 10,000) × 100 = 25%
That 25% applies only to this market, set, platforms, and period.
The Formula Changes With the Input, Not the Math
- Social: Brand mentions ÷ total relevant mentions × 100
- Advertising: Brand ad visibility ÷ total competitive ad visibility × 100
- Search: Brand search visibility ÷ total measured search visibility × 100
- PR: Brand coverage ÷ total relevant coverage × 100
If you use mentions and a competitor is scored on impressions, the comparison is meaningless.
Why the Denominator Matters
For a standard category share, include yourself:
Total Market Visibility = Your Brand + Competitors
Excluding yourself (brand ÷ competitors only) answers a different question.
A complete SOV statement names what, where, who, when, geography, and audience.
How to Calculate Share of Voice
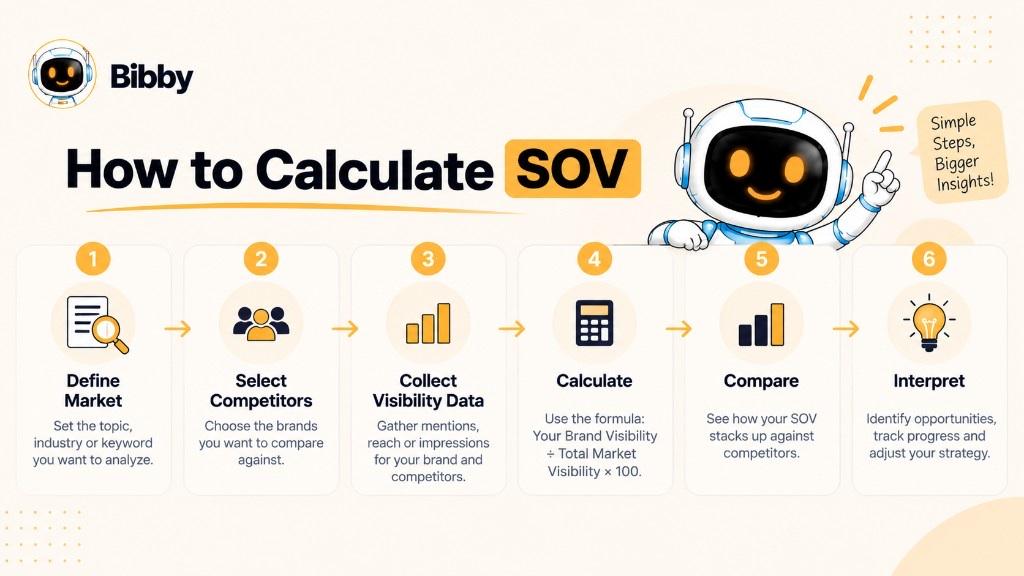
Define the market → Select competitors → Choose the metric → Collect data → Calculate → Compare → Interpret
Step 1: Define the Market
Industry, geography, audience, language, channel, topics, period. Prefer “fitness apps among U.S. consumers in September” over “SOV for a fitness brand.”
Step 2: Identify Competitors
Direct rivals, category leaders, new entrants, alternatives. Do not reshuffle the list every month without documenting it.
Step 3: Choose What “Visibility” Means
| Measurement | What it can represent |
|---|---|
| Mentions | Relevant conversations or references |
| Impressions | Measured or potential exposure |
| Reach | People potentially or actually reached |
| Media coverage | Relevant articles or publications |
| Search visibility | Presence across a keyword set |
| Advertising exposure | Measured advertising presence |
Who dominates conversation (mentions) is a different question from who gets the most exposure (impressions).
Step 4: Collect the Data
Use the same type of data for every brand. For social SOV that may be mentions, product names, hashtags, campaign talk, or public posts—only what you are permitted to collect. Filter brand names that are also common words.
Step 5–6: Total, Then Apply the Formula
2,000 + 3,000 + 2,500 + 2,500 = 10,000. Your SOV = 2,000 ÷ 10,000 × 100 = 20%. Repeat for each competitor.
Step 7: Compare Over Time
| Month | Brand SOV |
|---|---|
| January | 18% |
| February | 20% |
| March | 23% |
| April | 27% |
An increase is not automatic proof marketing improved. You may have become more visible, competitors quieter, or the conversation different.
Step 8–9: Other Metrics and Causes
Compare with reach, impressions, engagement, engagement rate, sentiment, traffic, leads, conversions, sales, and market share. Then ask *why*: campaign, volume, viral content, influencer activity, launch, PR, trend, or competitor inactivity.
Keep competitors + platforms + audience + geography + topics + metric + period as stable as you can.
Share of Voice Example
The math stays the same. The definition of visibility changes.
Example 1: Social Media Share of Voice
Brand A 4,000 / 10,000 = 40%. Not 40% of revenue—40% of these mentions.
Example 2: After a Campaign
Before: 2,000 of 10,000 = 20%. After: 4,000 of 12,000 ≈ 33.3%. Mentions doubled; SOV rose. Still check engagement, sentiment, reach, and conversions.
Example 3: Mentions Up, SOV Down
January: 2,000 of 8,000 = 25%. February: 2,500 of 15,000 ≈ 16.7%. You gained 500 mentions and lost relative share because the category grew faster.
Example 4: Advertising Share of Voice
Brand A 5M of 10M impressions = 50% of measured ad visibility in that set.
Example 5: Search Share of Voice
If visibility scores sum to 100 and Brand A has 35, search SOV is 35% for that keyword set. Rankings, impressions, and clicks are not the same input.
Example 6: PR Share of Voice
125 of 500 relevant articles = 25% media SOV for the quarter.
Always report what, who, where, and when.
What Is Share of Voice in Social Media?
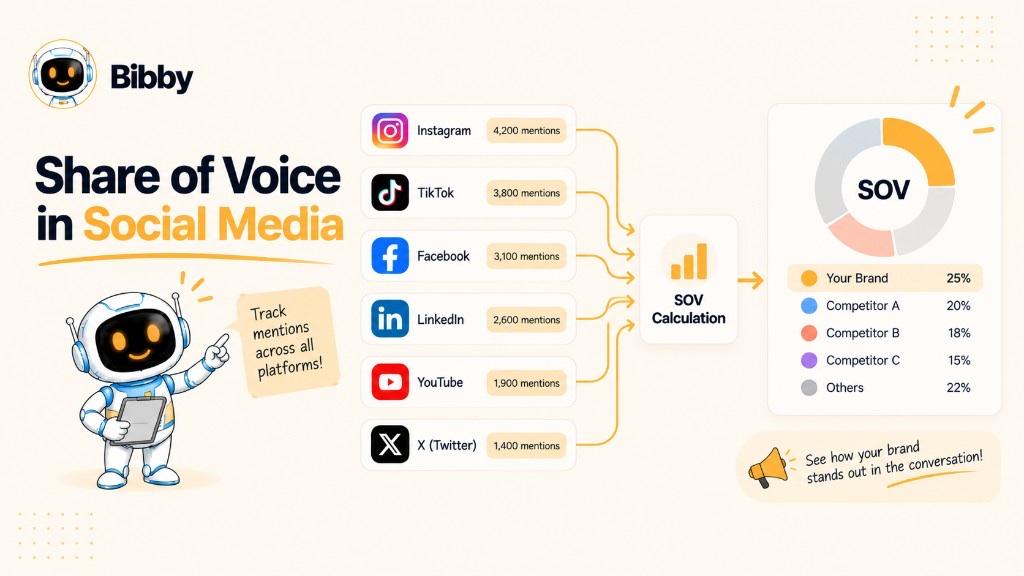
Social media Share of Voice measures how much of the relevant conversation or visibility around a market, topic, product, or category belongs to your brand versus competitors.
5,000 of 20,000 relevant mentions = 25%.
Inputs may include mentions, product names, campaign tags, hashtags, public posts, reach, impressions, or engagement. Mention-based SOV asks how much of the conversation refers to you. Impression-based SOV asks how much of the measured exposure is yours.
You can measure one platform or several—Facebook, Instagram, TikTok, YouTube, LinkedIn, X, Reddit, or other communities. Instagram SOV and TikTok SOV can tell different stories. Keep the platform set consistent between periods.
Your own analytics show followers, posts, reach, and engagement. SOV asks: how much of the category conversation is ours? Engagement up 20% while competitors jump 80% can still be a weaker relative position.
Campaigns and Competitors
Before 18% → during 27% → after 23% is a useful pattern. A spike can be temporary. Pair SOV with reach, impressions, engagement, sentiment, traffic, leads, and conversions.
A 45% mention share can come from praise, criticism, a viral event, creators, or a launch. Read sentiment, themes, and outcomes—not the percentage alone.
SOV can rise from campaigns, volume, viral posts, influencers, launches, customers, trends, or media—and fall when competitors get louder, attention shifts, you publish less, or a trend ends. It can move while your activity stays flat.
High SOV with negative conversation is not a win. A useful stack is SOV + sentiment + engagement + reach + conversions.
Topic-level SOV can show competitors owning tutorials, trends, education, comparisons, or UGC—useful content intelligence.
Automation helps execute the strategy. SOV measures relative presence. Bibby can organize creation and scheduling across supported platforms. It does not calculate SOV. Publishing more does not automatically raise your share.
How to Measure Share of Voice on Social Media
Choose platforms → Define the conversation → Identify competitors → Collect data → Filter → Calculate → Track
- Platforms: Where the audience and competitors actually are. Extra networks can add noise.
- Conversation: Brand and product names, campaign tags, category terms, competitor names, topics. Narrow enough to be relevant, wide enough to be useful.
- Competitors: A fixed list. A new brand rapidly gaining SOV is itself a signal.
- Data: Mentions for conversation SOV; impressions, reach, or views for exposure SOV. Document the source.
- Filter: Spam, bots, duplicates, unrelated names, off-market news.
- Total: Sum the set (example: 2,500 + 2,000 + 3,000 + 1,500 + 1,000 = 10,000).
- Calculate: 2,500 ÷ 10,000 × 100 = 25%.
- Time series: Watch both brand volume and market volume. 15% → 18% → 20% → 22.5% is a trend, not a verdict.
- By platform: Overall 25% can hide Instagram 35% and LinkedIn 17%.
- With sentiment: 40% SOV that is mostly angry is not the same as 30% that is mostly positive.
- With engagement and reach: More mentions with falling engagement is a different story.
- Around campaigns: Before / during / after, then ask what drove the change—posts, creators, UGC, paid, launches, PR, or competitors.
Challenges include ambiguous names, incomplete public data, bots, duplicates, different platform APIs, viral distortions, algorithms, and audience segments. Treat social SOV as a defined framework, not a number every tool will match.
Document platforms, conversation rules, competitors, metric, dates, geography, audience, and filters every time.
Share of Voice vs Market Share
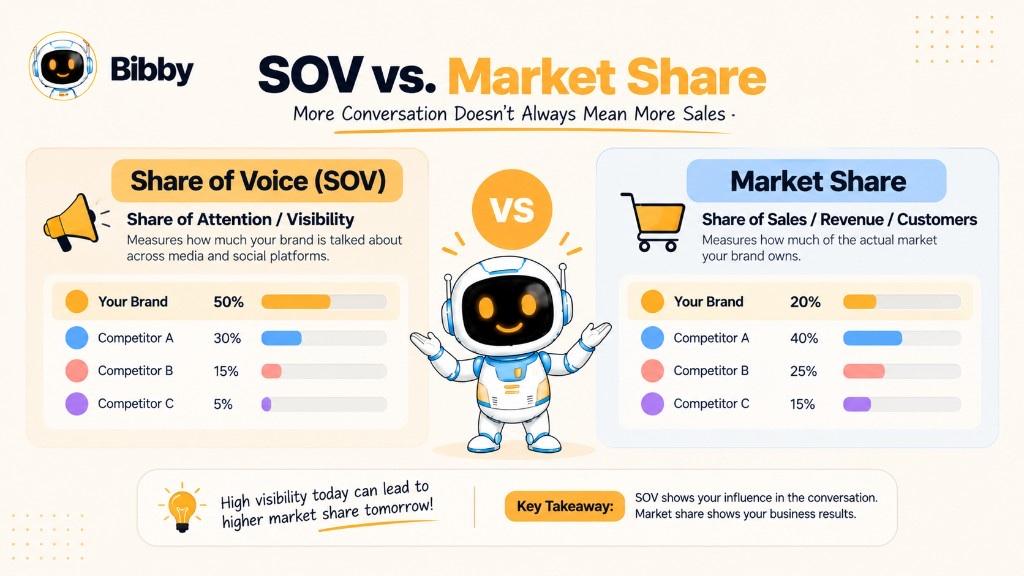
SOV asks: How much attention do we receive compared with competitors?
Market share asks: How much of the market do we own commercially (sales, revenue, customers, or units)?
| Metric | Share of Voice | Market share |
|---|---|---|
| Measures | Relative visibility or conversation | Relative commercial position |
| Focus | Attention and awareness | Sales, revenue, customers, or units |
| Typical question | How much attention are we capturing? | How much of the market do we control? |
A new brand can have 35% SOV and 10% market share—lots of attention, not yet equivalent sales. An established brand can have 15% SOV and 40% market share—loyalty and distribution without dominating this month's conversation.
Neither metric replaces the other. 50% SOV is not 50% of customers. Report them separately.
Share of Voice = share of attention. Market share = share of business.
Share of Voice vs Share of Search
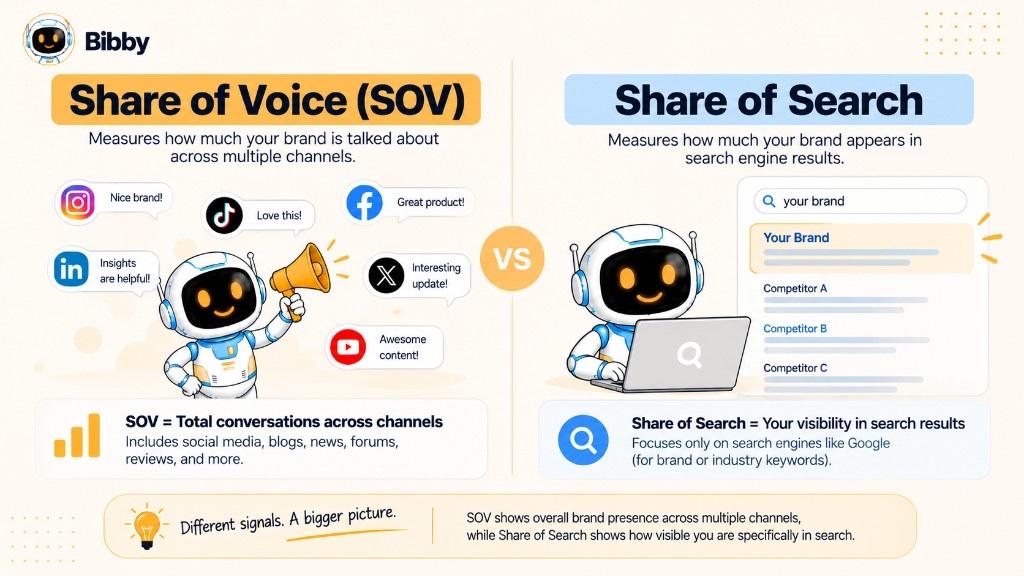
SOV can cover many channels. Share of Search (SOS) is specifically search activity or search visibility.
Social SOV of 25% (5,000 of 20,000 mentions) says nothing about search. A brand can have 40% social SOV and 15% search SOV, or the reverse.
Search visibility (where you appear) is also not the same as search demand (what people type). When you report Share of Search, say whether it is volume, interest, organic visibility, impressions, paid exposure, or a vendor score.
Use SOV for broader competitive attention; use Share of Search when the question is the search landscape. Together they show where visibility is concentrated.
Share of Voice vs Share of Conversation
In social listening, the labels are often used interchangeably. Share of Conversation usually emphasizes mentions and discussions. Share of Voice can also mean impressions or coverage.
If both use the same mention data, the percentages match. If SOV is impressions and conversation is mentions, Brand A can lead exposure while Brand B leads discussion. Look at the data, not only the label.
Why Is Share of Voice Important?
Your own analytics show what happened to you. SOV shows whether you gained or lost ground versus competitors.
It helps you:
- Measure competitive visibility
- Spot topic or platform gaps
- Evaluate campaigns (18% → 29% → 23%)
- Track visibility trends by quarter
- Notice sudden competitor jumps
- Add context to awareness work (SOV is not proof of awareness)
- See where you are strongest (platform, topic, product, geography)
- Compare absolute volume with relative share (50,000 mentions at 25% vs 20,000 at 40%)
- Inform content strategy
- Line up visibility with awareness → traffic → leads → conversions → revenue—without claiming causation
SOV is a diagnostic, not a scorecard for product quality, preference, sentiment, or revenue. Low SOV is not automatically failure.
What Is a Good Share of Voice?
There is no universal good SOV. Ten equal brands make 10% look average. Three giants make 10% look small. Objectives differ: awareness, a launch spike, defending share, or a niche audience.
50% can mean you dominate—or that competitors were quiet, a viral week inflated mentions, or the set is tiny. 10% can be a win for a small brand or a gap for a would-be leader.
Compare with your baseline, largest competitor, and market share. Example target: 18% now, largest rival 31%, aim for 22% next quarter—not “we need 40%” from nowhere.
Judge quality: 40% mostly negative vs 25% positive with strong engagement. The best benchmark is your competitive baseline, not a magic number.
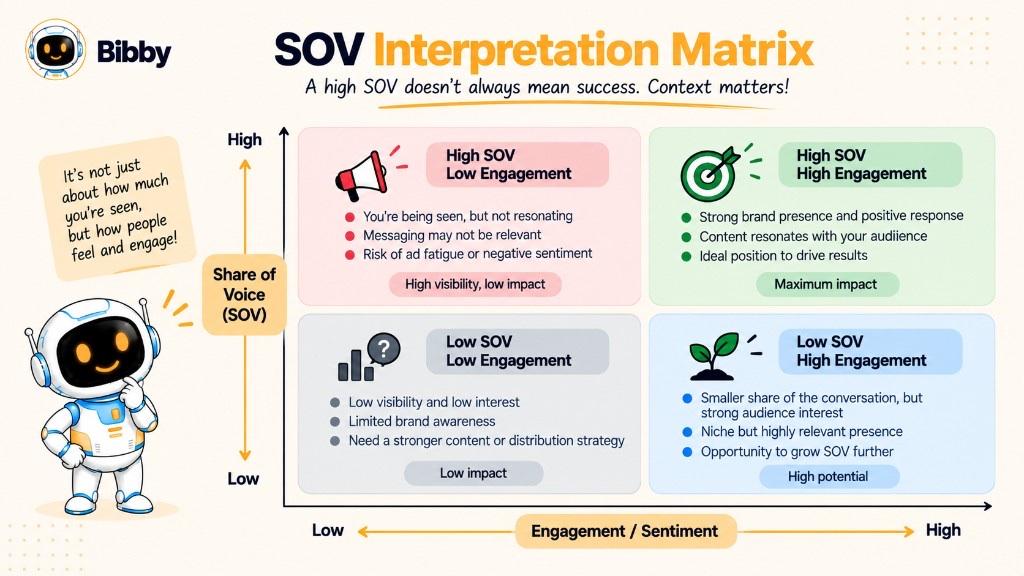
How to Interpret Share of Voice
| Pattern | What to check |
|---|---|
| Rising SOV | Campaign, volume, launch, creators—or quieter rivals |
| Falling SOV | Your drop, their surge, or a bigger conversation |
| High SOV + high engagement | Visibility with interaction |
| High SOV + low engagement | Noise, controversy, or weak interest |
| High SOV + negative sentiment | Reputation risk, not a win |
| Low SOV + high market share | Loyalty and distribution; maybe protect visibility |
| High SOV + low market share | Attention not yet converting |
| Mentions up, SOV down | Category grew faster than you |
Also split by topic and platform, and treat sudden spikes as events to investigate. Ask: Did SOV move? What did competitors do? Did absolute volume move? Why? Sentiment? Which surfaces? Did business outcomes move?
What Affects Share of Voice?
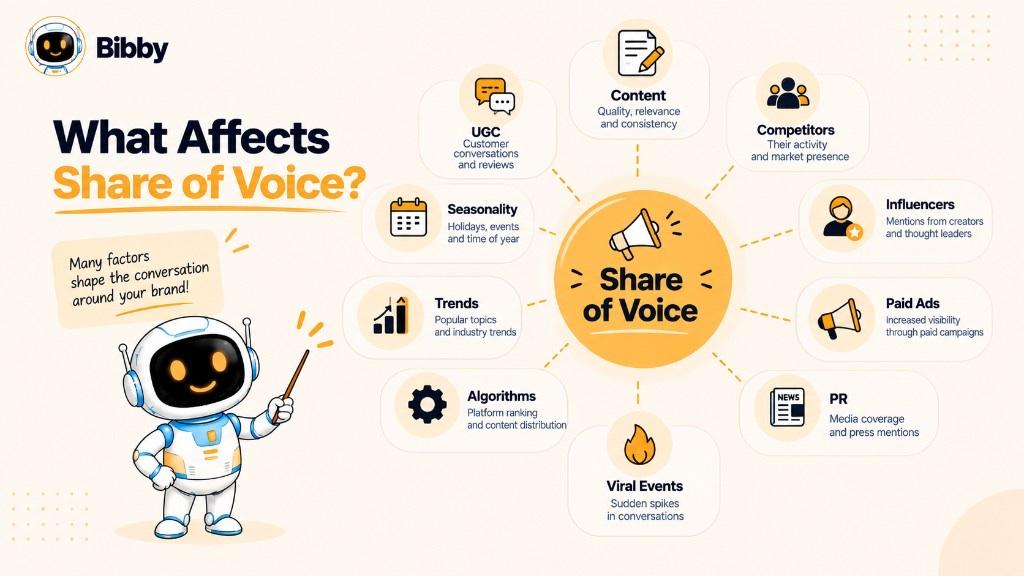
Because SOV is relative, it can move when you stay still.
Influences include content volume and quality, campaigns, competitor activity, creators, viral posts, launches, PR (good or bad), paid ads, algorithms, audience shifts, seasonality, trends, reputation, UGC, geography, and how you calculate.
You can influence: strategy, consistency, campaigns, ads, creators, community, launches, PR.
You often cannot: rival campaigns, news, algorithms, seasons, surprises.
Your SOV rises if you get more visibility or they get less—and falls in the opposite cases. Always look at the whole set.
How to Use Share of Voice for Social Media Campaigns
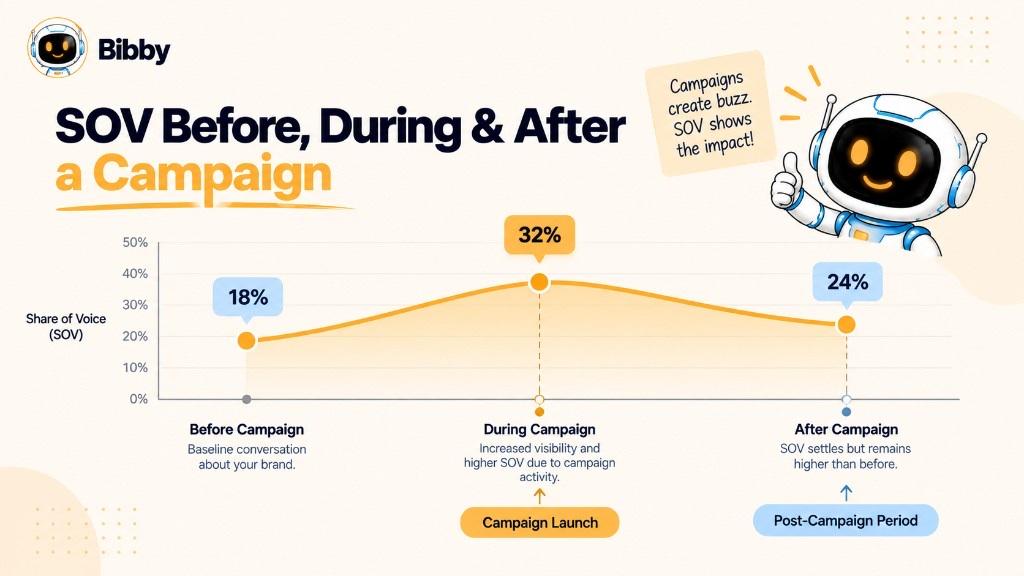
Measure before → during → after.
Establish a baseline (you 18%, A 32%, B 27%, C 23%). Decide whether the campaign should move overall SOV or SOV around a product, hashtag, audience, or platform. Lock platforms, competitors, topics, geography, metric, and dates before you launch.
Watch weekly movement and competitor SOV at the same time. Your 18% → 25% looks weaker if a rival goes 20% → 40%. Break out platforms and formats (carousels, short-form video, Stories). Pair with sentiment and engagement. Check whether the lift holds a month later.
Ask which posts, creators, platforms, topics, paid support, or external events drove the change. Use that to plan the next campaign.
Bibby can create and schedule campaign assets across supported platforms. Automation does not raise SOV by itself. Listening tools measure the conversation; Bibby executes publishing.
Share of Voice and Social Media Automation
SOV is a measurement. Social media automation is an execution tool.
Scheduling can support consistency, multi-platform distribution, testing captions and formats, and campaign calendars. It does not guarantee a higher share. Hundreds of weak posts can still lose to fewer relevant ones.
A useful loop:
Plan → Create → Schedule → Publish → Measure SOV (elsewhere) → Analyze → Optimize
Bibby covers create, schedule, and publish. SOV belongs in listening or analytics.
How to Increase Share of Voice
You need more relevant relative visibility, not just more posts.
- Publish around customer problems, category topics, and useful education
- Make content worth discussing (video, carousels, tutorials, stories)
- Close topic gaps competitors own—with a distinct angle, not copies
- Strengthen platforms where the audience actually is
- Work with creators when it fits the method
- Encourage genuine UGC
- Join relevant trends only
- Separate organic SOV from paid advertising SOV
- Support visibility with PR when it is real news
- Build content on high-interest questions
- Improve distribution (repurposing, timing, communities)—scheduling helps operations
- Participate in comments and questions that are already happening
- Make distinctive research, commentary, or creative
- Watch competitor campaigns so you do not misread a quiet month
- Balance consistency, relevance, quality, and distribution
- Recalculate on a fixed cadence and investigate dips
Measure → find gaps → create → distribute → amplify → watch competitors → recalculate → optimize. Aim for relevant, preferably constructive visibility that also supports engagement and business outcomes.
Common Share of Voice Measurement Mistakes
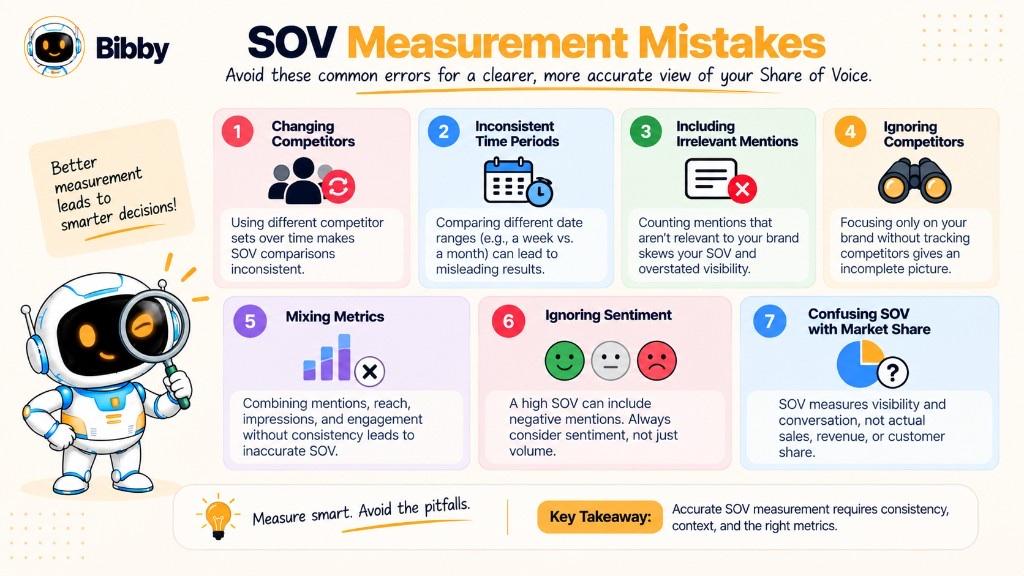
- Unclear visibility definition
- Changing the competitor set
- Mismatched time windows
- Counting irrelevant mentions
- Ignoring spam and bots
- Treating SOV as market share
- Assuming higher is always better
- Ignoring absolute volume
- Ignoring competitor activity
- Blending platforms that hide gaps
- Changing method mid-trend
- Uneven keywords or hashtags per brand
- Ignoring geography
- Treating a viral week as a new baseline
- Using SOV as the only KPI
- Failing to document the method
Consistency with context is the rule.
Limitations of Share of Voice
SOV does not measure sales, guarantee positive attention, or use one universal method. Social data is not the whole market. Collection can miss private or deleted talk. Competitor choice and viral events distort results. The percentage does not explain *why*, hide platform differences, prove audience quality, or equal brand awareness. Benchmarks differ by industry. Publishing more—or using automation—does not fix a bad method.
Use SOV + absolute volume + sentiment + engagement + conversions + market share when you need a decision, not a vanity percentage.
Share of Voice: Key Takeaways
Share of Voice = Your Brand's Visibility ÷ Total Market Visibility × 100
The hard part is defining visibility, competitors, channels, and period. For social media, SOV helps you benchmark, find gaps, evaluate campaigns, see which platforms and topics move, and put your own metrics in competitive context.
A rising SOV can be good attention, bad attention, or a quieter competitive set. Always ask:
Why did it change, what caused it, how do competitors compare, and did the extra visibility create meaningful results?
Continue with brand awareness, social listening, sentiment analysis, reach, impressions, engagement, and social media analytics—or browse the social media dictionary. Then start a free Bibby trial to create, caption, and schedule content across your channels.