

Unlike likes, followers, impressions, and engagement, Social Media ROI connects social activity to measurable business outcomes. A campaign can generate thousands of interactions and still produce little financial return. A smaller campaign can deliver substantial revenue or leads with a much higher return.
ROI is typically expressed as a percentage: compare the return generated by social media with the total investment required to produce that return. That helps you evaluate campaigns, compare platforms, allocate budgets, and find where performance can improve.
As teams publish more consistently on Facebook, Instagram, LinkedIn, YouTube, and TikTok, the operational cost of creating and scheduling can rise. Social media automation such as Bibby can reduce the effort of creating, captioning, and scheduling—on the investment side. Bibby does not calculate ROI, run ads, or replace Insights.
This guide covers what Social Media ROI means, how to calculate it, which metrics matter, organic vs. paid measurement, attribution challenges, and practical ways to improve return.
What Does Social Media ROI Mean?
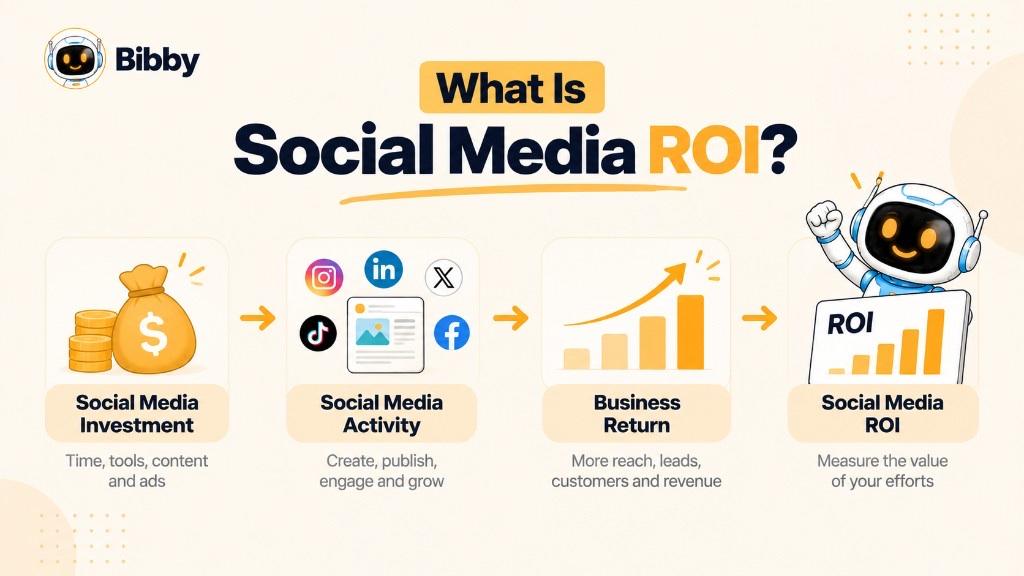
Social Media ROI is a measure of how much financial value you generate compared with the resources you invest in social media. It tells you whether money, time, and effort are contributing to business growth—not only whether content was popular.
The investment is more than ad spend. It can include ads, production, salaries or hours, agency fees, influencer payments, creative services, and management tools.
The return also varies by model. Ecommerce may use attributed sales. B2B may use qualified leads that become customers. SaaS may use subscriptions or customer lifetime value.
Social Media ROI vs. Social Media Metrics
Social Media ROI is not the same as social performance metrics.
Likes, comments, followers, reach, impressions, and shares describe how people interact with content. They do not automatically tell you whether the investment generated financial value.
| Metric | What it measures | Directly measures ROI? |
|---|---|---|
| Likes | Audience reactions | No |
| Followers | Audience growth | No |
| Reach | People exposed to content | No |
| Impressions | Content displays | No |
| Engagement rate | Interaction intensity | No |
| Clicks | Traffic from social | No |
| Conversions | Desired actions completed | Can contribute |
| Revenue | Financial value generated | Yes, when attributable |
| Social Media ROI | Return relative to investment | Yes |
A post with 100,000 impressions and 10,000 likes can still produce no leads or purchases. A LinkedIn post with a few thousand views can generate high-value B2B leads. Reach can be lower while potential ROI is higher.
These figures are illustrations. Review real numbers in native Insights, ads managers, or an analytics product—not in Bibby.
Why the Investment Side Matters
Teams sometimes calculate Social Media ROI using only advertising costs. That can be useful for paid tests, but it may not be the true cost of social marketing.
If a company spends $1,500 on ads, $1,000 on content, $750 on management, and $500 on software, the relevant investment is not $1,500 when all of those resources supported the campaign.
This is where automation can matter. Less manual work on visuals, captions, scheduling, and multi-platform publishing can lower operational resources. The goal is not simply to post more. It is to get meaningful outcomes while using resources efficiently.
Why Social Media ROI Matters
A financial framework lets you ask whether activity contributed to revenue, leads, customers, or another objective—not only whether it earned engagement.
A clear ROI practice can help you:
- See which campaigns produce the strongest financial returns
- Compare platforms with the same cost method
- Identify high-performing content and audiences
- Allocate social budgets
- Understand customer-acquisition cost through social
- Evaluate organic and paid social
- Justify spend to stakeholders
- Cut inefficient work
- Plan the next content and advertising investments
ROI is the general finance idea. Social Media ROI applies that idea to social programs. Run the math in finance or analytics tools.
Social Media ROI Formula
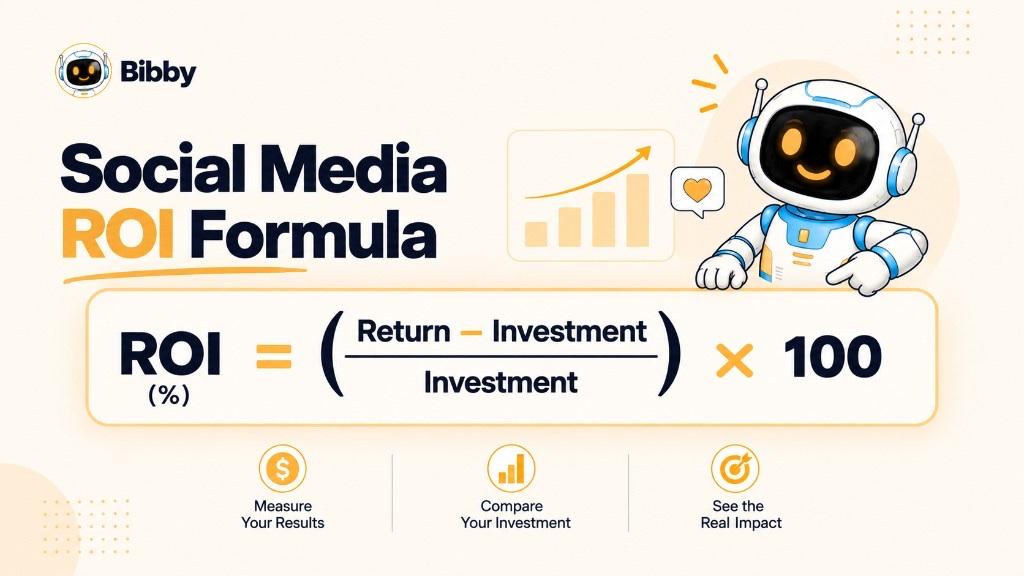
The standard formula is:
Social Media ROI = [(Return from Social Media − Social Media Investment) ÷ Social Media Investment] × 100
A positive percentage means return exceeded investment. A negative percentage means investment exceeded measurable return.
Return From Social Media
Return is the measurable financial value of social activity. Depending on the model, that can include attributed purchases, new-customer revenue, subscription revenue, converted leads, app purchases, ecommerce transactions, customer lifetime value, or another conversion value you can defend.
If a campaign generates $15,000 in attributable sales, the return in the formula is $15,000. When social does not produce immediate purchases, you may need to assign a monetary value to leads using historical rates.
Social Media Investment
Investment is the resources used to produce those results: ad spend, content and design, video, management, employee time, agency fees, creator fees, scheduling software, and campaign-specific expenses.
A paid-only calculation may focus on ad spend. A broader marketing ROI may include content, labor, software, and management. Those are different questions.
Social Media ROI Formula Example
A company invests $5,000 and attributes $12,500 in revenue.
Social Media ROI = [($12,500 − $5,000) ÷ $5,000] × 100 = 150%
That is $1.50 in net return for every $1 invested, based on the figures included. Dollar amounts are worked examples, not a Bibby report.
Why Cost Measurement Must Stay Consistent
Comparing two campaigns is misleading if one includes labor and content and the other includes ads only.
For overall marketing ROI, you might include advertising + content + labor + software + agency or creator costs.
For advertising efficiency, you may use ad spend and calculate ROAS separately. Social Media ROI and ROAS are related but not interchangeable.
Social Media ROI Formula at a Glance
| Component | Meaning |
|---|---|
| Return | Financial value generated by social media |
| Investment | Resources used to generate that return |
| Return − Investment | Net return |
| Net return ÷ Investment | Return relative to investment |
| × 100 | Converts the result to a percentage |
The formula is simple. Practice is harder: what counts as return, which costs belong, and how you attribute conversions.
How to Calculate Social Media ROI
A useful calculation has seven steps.
1. Define Your Social Media Objective
Decide what the work is supposed to achieve: product sales, qualified leads, subscriptions, app installs, website traffic, demo requests, new customers, or repeat purchases.
An ecommerce brand may use revenue from social purchases. A B2B company may use qualified leads and later revenue. Without an objective, you cannot tell whether the investment produced a valuable outcome.
2. Calculate Your Total Social Media Investment
Depending on scope, include advertising, content, design, video, employee time, management, agency fees, influencer partnerships, software, and campaign expenses.
Example: $2,000 ads + $1,000 production + $500 management + $300 software = $3,800. Use the same method across campaigns and platforms.
3. Track Social Media Conversions
Connect activity to purchases, lead forms, registrations, installs, demos, subscriptions, downloads, or contact requests.
Useful methods include UTM parameters, website analytics, platform conversion tracking, CRM data, and ecommerce analytics. A UTM on a social link can identify the platform, campaign, or post. When that visitor purchases, you have a stronger basis for attribution. Use supported tools and respect consent—do not scrape or bypass access controls.
4. Determine the Financial Value of Your Return
Direct sales: 100 purchases × $100 average order value = $10,000 (if attribution supports it).
Lead generation: 100 qualified leads × $150 estimated value per lead = $15,000. Use a consistent, documented method—not arbitrary values.
5. Apply the Social Media ROI Formula
$10,000 return and $4,000 investment:
ROI = [($10,000 − $4,000) ÷ $4,000] × 100 = 150%
Calculate this in a spreadsheet or analytics product.
6. Compare ROI Across Campaigns and Platforms
Compare Facebook vs. Instagram, LinkedIn vs. TikTok, organic vs. paid, video vs. carousel, audiences, objectives, creative, and posting strategies.
Instagram may generate more engagement while LinkedIn generates fewer interactions and more high-value leads. Likes can make Instagram look better; financial return can tell a different story.
7. Optimize Based on the Results
Increase budget or reuse elements that work. Revise or stop work that consumes resources without outcomes.
Optimization can include targeting, creative tests, formats, calls to action, budgets, landing pages, platforms, repurposing strong content, publishing consistency, and cutting unnecessary operational cost.
Automation can influence this last step. Less manual caption, schedule, and publish work can lower the resources invested. Bibby can upload or generate content, draft captions, select platforms, and schedule at AI-optimized times. Automation is not ROI. It can make the investment side more efficient.
A Simple Social Media ROI Calculation Framework
Define objective → Calculate investment → Track conversions → Assign financial value → Calculate ROI → Compare results → Optimize
That turns social media analytics into a business question: How much financial value did the investment generate?
Social Media ROI Example
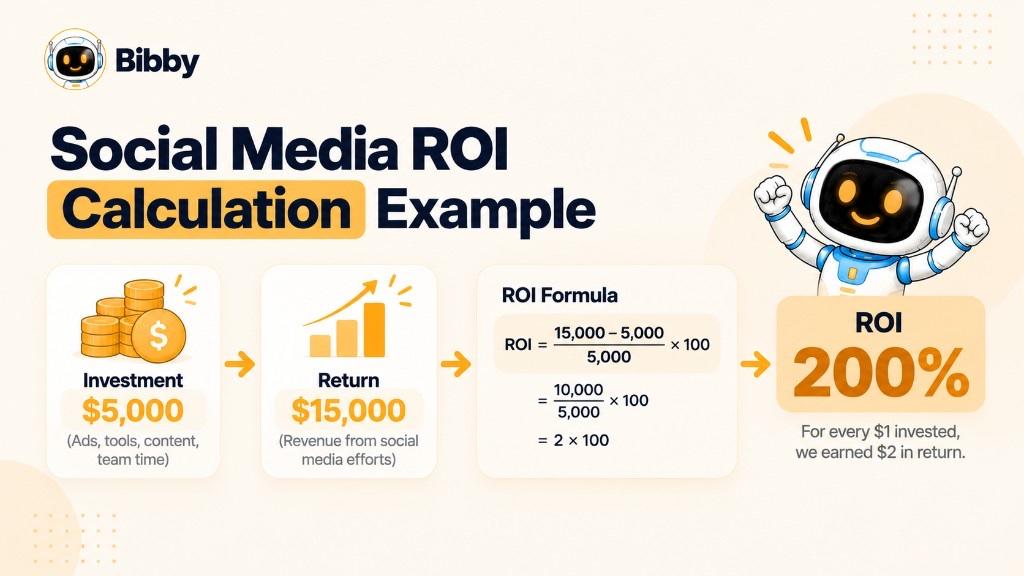
Example 1: Calculating ROI From Social Media Sales
Investment: $3,000 ads + $1,500 content + $500 management = $5,000.
Attributed revenue: $15,000.
ROI = [($15,000 − $5,000) ÷ $5,000] × 100 = 200%
That is $2 in net return for every $1 invested on those figures.
Example 2: Social Media ROI for Lead Generation
A B2B company invests $10,000 in a LinkedIn campaign and generates 200 qualified leads. History shows 10% become customers and each customer averages $8,000 in revenue.
200 × 10% = 20 customers → 20 × $8,000 = $160,000 estimated revenue
ROI = [($160,000 − $10,000) ÷ $10,000] × 100 = 1,500%
Treat this as estimated ROI. It depends on lead quality and attribution—not on a guaranteed close rate.
Example 3: Organic Social Media ROI
Organic still costs money. $2,000 content + $1,500 employee time + $500 software = $4,000. Attributed revenue: $12,000.
ROI = [($12,000 − $4,000) ÷ $4,000] × 100 = 200%
Ads-only math can hide the real investment. Organic has no media-buying bill and can still consume substantial time.
Example 4: Improving ROI Through Operational Efficiency
Two businesses generate the same $20,000 in social-attributed revenue.
First spends $10,000: ROI = 100%.
Second spends $7,500 with a more efficient workflow: ROI ≈ 166.7%.
Improving ROI does not always mean more revenue. Lower resources for comparable results also improve return. Automation can matter here if it reduces measurable operational cost.
What These Examples Show
- Revenue alone is not ROI. Compare return with investment.
- Ad spend is not always the full investment.
- Lead-generation ROI often uses estimated values.
- Organic social can have measurable ROI.
- Efficiency can improve ROI when it reduces the resources required.
- Attribution matters. A revenue figure is only useful if you can reasonably connect it to social activity.
The most useful calculation is not the biggest percentage. It is the one built on consistent costs, credible conversions, and a transparent attribution method.
What Is a Good Social Media ROI?
There is no universal “good” percentage. A strong result depends on industry, margins, acquisition cost, business model, objective, platform, attribution, and which costs you include. A 100% ROI can be excellent for one campaign and weak for another.
Is 100% Social Media ROI Good?
100% means net return equals the original investment. Invest $5,000, attribute $10,000 in revenue: ROI = 100%. Whether that is good still depends on margins and which costs you counted.
What Determines a Good Social Media ROI?
Industry. A $30 product and a software customer worth thousands cannot share one benchmark.
Profit margins. Revenue is not profit. A $50,000 campaign can be worse than a $30,000 campaign if costs or margins differ. Be clear whether you are calculating revenue-based or profit-based ROI.
Customer acquisition cost. If you can profitably acquire a customer for $100, a $120 acquisition cost may need work even when revenue looks large.
Customer lifetime value. First purchase is not always the full value. Subscriptions, SaaS, memberships, and repeat brands may earn more later. CLV can be more useful than first-order revenue alone.
Campaign objective. Awareness, lead generation, traffic, launches, retention, installs, community, and direct sales should not all use the same short-term revenue test. Brand awareness work often needs a longer window.
Compare ROI With Your Own Historical Performance
Ask “Is our Social Media ROI improving?” as well as “What is a good ROI?”
| Campaign | Investment | Return | ROI |
|---|---|---|---|
| Campaign A | $5,000 | $10,000 | 100% |
| Campaign B | $5,000 | $12,500 | 150% |
| Campaign C | $5,000 | $15,000 | 200% |
If methodology stays the same, the move from 100% to 200% is useful evidence of efficiency.
Compare Social Media ROI With Other Marketing Channels
Compare social with search ads, email, influencer work, content marketing, affiliates, display, and organic search. Do not move the entire budget to the highest percentage. Each channel can play a different role. Read ROI beside scale, profitability, customer quality, and strategic value.
Why a High Social Media ROI Can Still Be Misleading
$500 return on $100 is 400%. $50,000 return on $20,000 is 150%. The second campaign produces far more net return. Track efficiency and absolute contribution.
What Should Businesses Track Alongside ROI?
Social Media ROI, revenue, profit, ROAS, CAC, CLV, conversion rate, cost per lead, cost per acquisition, conversion volume, revenue per customer, and attribution data. Together they beat any single percentage.
A good Social Media ROI generates sustainable financial value relative to resources and meets the campaign’s objective. There is no magic number—only a number that fits your model, costs, goals, and growth plan.
Which Metrics Are Used to Measure Social Media ROI?
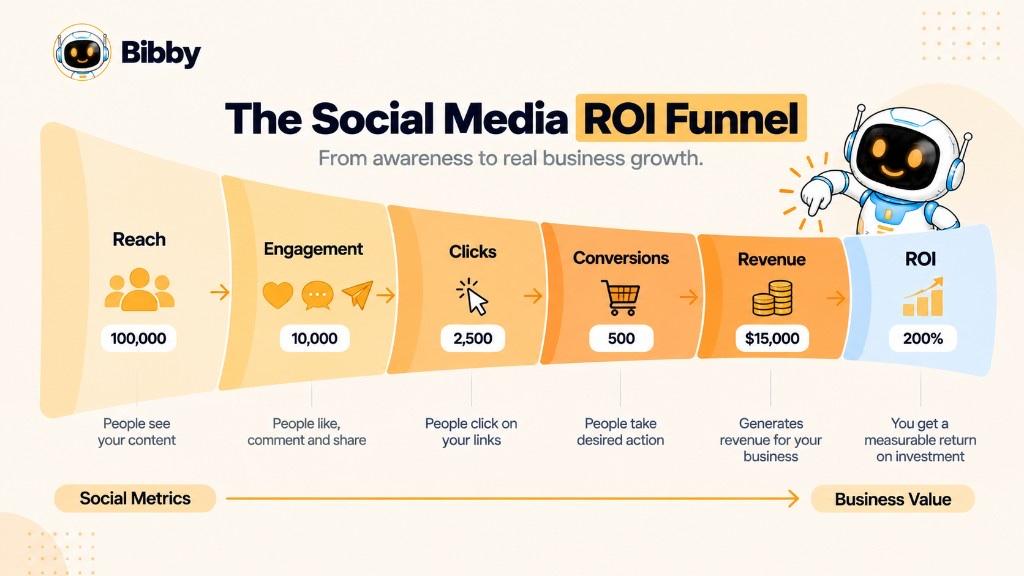
ROI is the financial outcome. Supporting KPIs explain where the return came from and how efficiently it was generated. Organize them as financial, conversion, traffic, engagement, and audience metrics.
Financial Metrics
Revenue. Social-attributed revenue is a core input for revenue-based ROI when attribution is reliable.
Profit. Revenue ignores fulfillment and product cost. Profit is more meaningful when you have the data.
Return on Ad Spend (ROAS). ROAS = Revenue from ads ÷ Advertising spend. Useful for paid social. Not the same as Social Media ROI.
Customer acquisition cost (CAC). CAC = Total acquisition cost ÷ New customers. Tells you whether social acquisition is sustainable.
Customer lifetime value (CLV). Expected revenue or profit over the relationship. Important when value appears months later.
Conversion Metrics
Purchases, leads, qualified leads, sign-ups, demos, installs, downloads, subscriptions, trials, and form submissions. A LinkedIn campaign may produce little immediate revenue and 50 qualified leads you later value in the CRM.
Conversion rate = Conversions ÷ Relevant visitors or clicks × 100. A high rate can mean social traffic has stronger intent.
Traffic Metrics
Sessions from social, referral traffic, landing-page visits, link clicks, CTR, and new users. Traffic is not ROI. It is often a step: post → visit → product page → purchase.
Engagement Metrics
Likes, comments, shares, saves, reposts, replies, video interactions, and engagement rate. These are diagnostic, not financial return. They answer “Is the audience responding?” ROI answers “Is the investment producing financial value?”
Audience Metrics
Reach, impressions, follower growth, growth rate, video views, unique viewers, and demographics. Useful for awareness. They do not independently prove ROI.
Social Media ROI Metrics at a Glance
| Metric | Primary purpose | Direct ROI metric? |
|---|---|---|
| Revenue | Financial return | Yes |
| Profit | Gain after costs | Yes |
| ROAS | Advertising efficiency | Related |
| CAC | Acquisition efficiency | Related |
| CLV | Customer value over time | Related |
| Conversions | Valuable actions | Supporting |
| Conversion rate | Conversion efficiency | Supporting |
| Clicks | Traffic | Supporting |
| CTR | Click efficiency | Supporting |
| Engagement rate | Audience interaction | Supporting |
| Reach | Exposure (unique) | No |
| Impressions | Content displays | No |
| Follower growth | Audience size | No |
Ecommerce priority: Revenue → Purchases → Conversion rate → CAC → ROI.
B2B: Qualified leads → Opportunities → Customers → Revenue → ROI.
SaaS: Trials → Paid conversions → Customer value → CAC → ROI.
Awareness: Reach → Qualified audience growth → Brand search → Assisted conversions → Longer-term revenue.
Think of a hierarchy: audience → engagement → traffic → conversion → financial metrics → Social Media ROI. That keeps dashboards from drowning you in vanity metrics.
Social Media ROI vs. ROAS
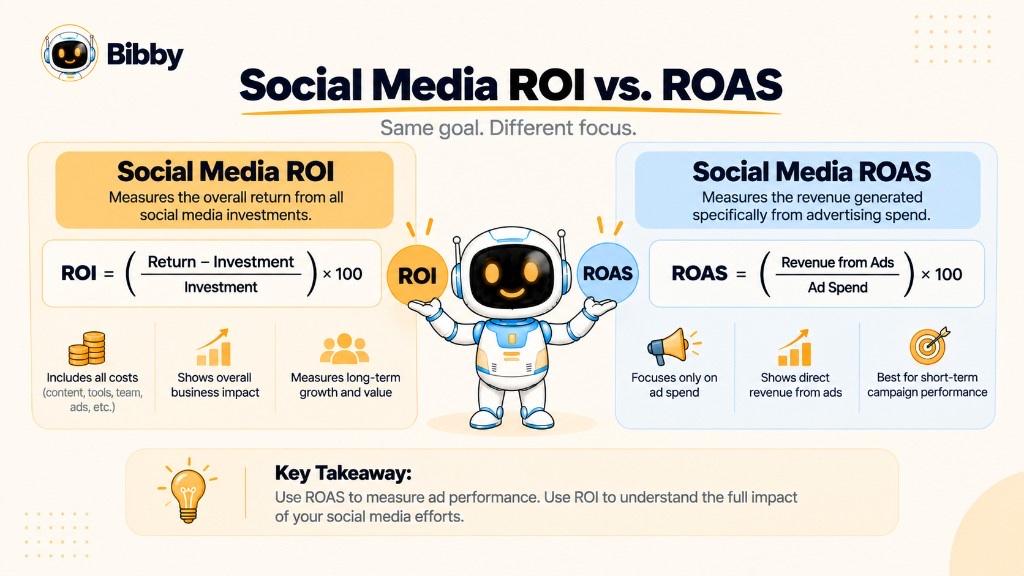
The biggest difference is what counts as investment.
ROI = [(Return − Investment) ÷ Investment] × 100
ROAS = Revenue ÷ Advertising spend
Example: $5,000 ads + $2,000 content + $1,000 management = $8,000 investment. Revenue: $20,000.
ROAS = $20,000 ÷ $5,000 = 4 ($4 revenue per $1 of ads).
ROI = [($20,000 − $8,000) ÷ $8,000] × 100 = 150%
Using ROAS as a substitute for Social Media ROI can make a campaign look more profitable when production and labor are large.
Key Differences Between Social Media ROI and ROAS
| Factor | Social Media ROI | ROAS |
|---|---|---|
| Full name | Return on Investment | Return on Ad Spend |
| Primary focus | Overall financial return | Advertising efficiency |
| Investment | Multiple social costs | Primarily ad spend |
| Result | Usually a percentage | Usually a ratio |
| Content, labor, software, agency | Can be included | Usually excluded |
| Best use | Broader return | Paid efficiency |
What Is ROAS Used For?
Comparing campaigns, ad sets, audiences, platforms, creatives, offers, products, and markets. Campaign B at 5.0x ROAS can be more efficient than Campaign A at 3.0x on the same ad spend—and still have a worse overall ROI if it needed more production or agency time.
Why ROAS Is Not the Same as Profit
$40,000 revenue on $10,000 ads is 4x ROAS. Product cost, shipping, discounts, content, labor, and software can still leave a thin profit. ROAS is an advertising efficiency metric, not a complete profitability measure.
Bibby does not run ads, pixels, or retargeting, and does not report ROAS. Paid measurement stays in ads managers.
When Should You Use Social Media ROI?
Use it when you want the broader financial picture: overall programs, organic and paid together, content investment, teams, agencies, software, influencer campaigns, and long-term strategy. A leader deciding whether to grow the social budget usually needs more than ROAS.
When Should You Use ROAS?
Use it when the question is “How efficiently is advertising generating revenue?” If Instagram Campaign A is 2.5x and Campaign B is 5x under comparable conditions, B deserves a closer look. Still weigh profitability, customer quality, and lifetime value before moving the entire budget.
Can a Campaign Have High ROAS but Low Social Media ROI?
Yes.
$10,000 ads and $50,000 revenue is 5x ROAS. Add $15,000 production, $10,000 agency, and $5,000 management: total investment $40,000.
ROI = [($50,000 − $40,000) ÷ $40,000] × 100 = 25%
Neither metric is wrong. They answer different questions. Use them together: ROAS for ad efficiency, Social Media ROI for the broader investment.
How to Measure Social Media ROI for Organic Social Media
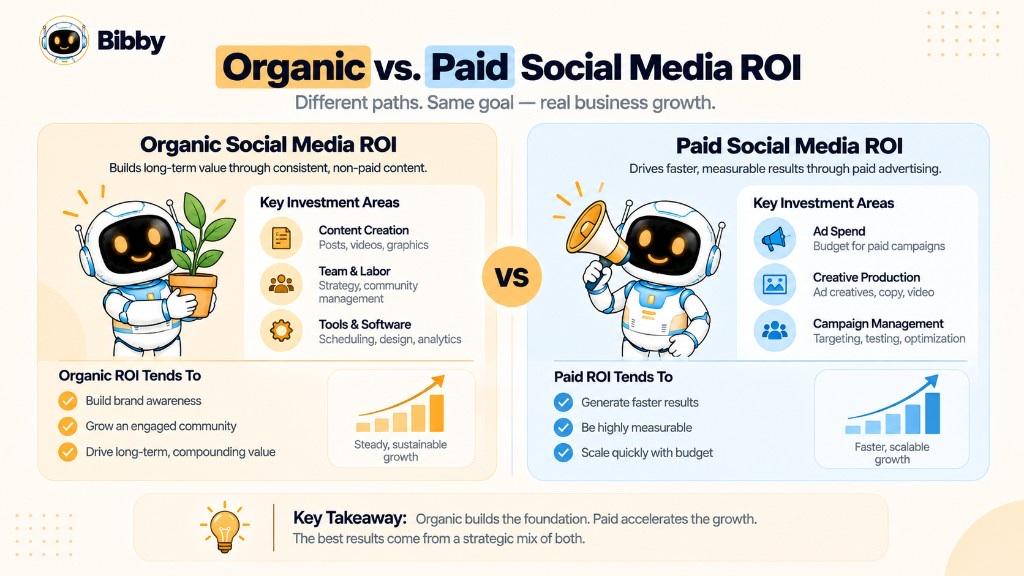
Organic has no media bill on every impression, but it still consumes content, strategy, time, community management, production, and tools.
- Define the outcome — traffic, leads, sales, audience, subscriptions, installs, demos, retention, or awareness.
- Cost the work — salaries, hours, copy, design, photo, video, strategy, community, creators, software, agencies. $3,000 content + $2,000 management is already $5,000/month with $0 in ads.
- Track traffic — sessions, landing pages, new users, clicks, traffic by platform and campaign. Use consistent UTMs. Traffic is not ROI.
- Track conversions — purchases, leads, trials, downloads, contacts. Ecommerce: post → visit → product → purchase. B2B: post → visit → download → lead → opportunity → customer.
- Measure revenue when attribution supports it — $6,000 investment and $18,000 attributed revenue is 200% ROI.
- Count assisted conversions — Instagram discovery, later Google search, then email purchase. Last-click can hide social. This matters for B2B, high-consideration, SaaS, and long cycles.
- Value leads when you do not sell in-feed — 100 qualified leads × 10% close × $5,000 = $50,000 estimated. Label it as modeled.
- Break out platforms — a lower-reach network can still produce higher-value customers.
- Separate engagement from money — Reach → Engagement → Traffic → Conversion → Revenue → ROI.
The Attribution Challenge With Organic Social Media
Journeys are rarely linear: see a post, follow, watch videos, search, visit directly, join email, buy later. First-click, last-click, linear, position-based, and data-driven models assign credit differently. Read ROI with the model you used.
Yes, organic can have a positive ROI when attributable value exceeds the resources used. Time has a cost even when the post itself is free. Bibby can help generate visuals, AI captions, campaigns, and schedules on supported channels. If that reduces measurable hours, the investment side can fall. Measure it; do not assume it.
How to Measure Social Media ROI for Paid Campaigns
Paid platforms report spend, impressions, clicks, and conversions, but a strong ROAS is not automatically a strong overall ROI.
- Define the objective — purchases, customers, leads, subscriptions, installs, launches, site conversions, bookings. Bibby does not serve ads; this section is about measurement in ads tools.
- Track campaign cost — media, management, creative, video, design, creators, landing pages, agency, relevant software. Narrow ROAS uses ad spend. Broader ROI includes production and management.
- Track conversions — purchases, leads, trials, installs, demos, bookings. Ecommerce needs purchase value. B2B needs CRM follow-through.
- Value conversions — 500 leads × 8% close × $4,000 = $160,000 estimated. Separate actual attributed revenue from estimates.
- Calculate ROAS — $40,000 revenue ÷ $10,000 ads = 4x.
- Calculate overall Social Media ROI — $10,000 ads + $3,000 creative + $2,000 management = $15,000. ROI = [($40,000 − $15,000) ÷ $15,000] × 100 ≈ 166.7%.
- Evaluate CPA — CPA = Campaign cost ÷ Conversions. $10,000 ÷ 200 customers = $50. Low CPA is not automatically good if customer quality is weak.
- Compare CAC with customer value — $75 CAC vs. $500 CLV can be sustainable; $75 CAC vs. $50 CLV is not.
- Compare platforms with the same method — also weigh volume, quality, AOV, CLV, scale, sales cycle, attribution confidence, and margins.
- Compare creative — images, carousels, short-form and long-form video, demos, testimonials, UGC, education, promotions. That turns ROI into an optimization system.
Paid attribution can still be messy: click, leave, search, buy later. Platforms and analytics tools may disagree on windows, view-through, retargeting, and cross-device paths. Document the window and method. Do not treat any model as perfect certainty.
Paid Social Media ROI: A Practical Measurement Framework
Objective → Advertising + campaign investment → Impressions and interactions → Clicks → Conversions → Revenue or estimated value → Attribution → Social Media ROI
If clicks rise and conversions stay flat, the landing page or offer may be the issue. If conversions are strong and ROI is weak, look at acquisition cost, margins, or campaign expenses.
Automation does not guarantee higher paid ROI. It can free time for creative tests, research, and conversion work. Evaluate Bibby the same way as any cost: resources in, measurable return out.
How to Measure Social Media ROI Across Different Platforms
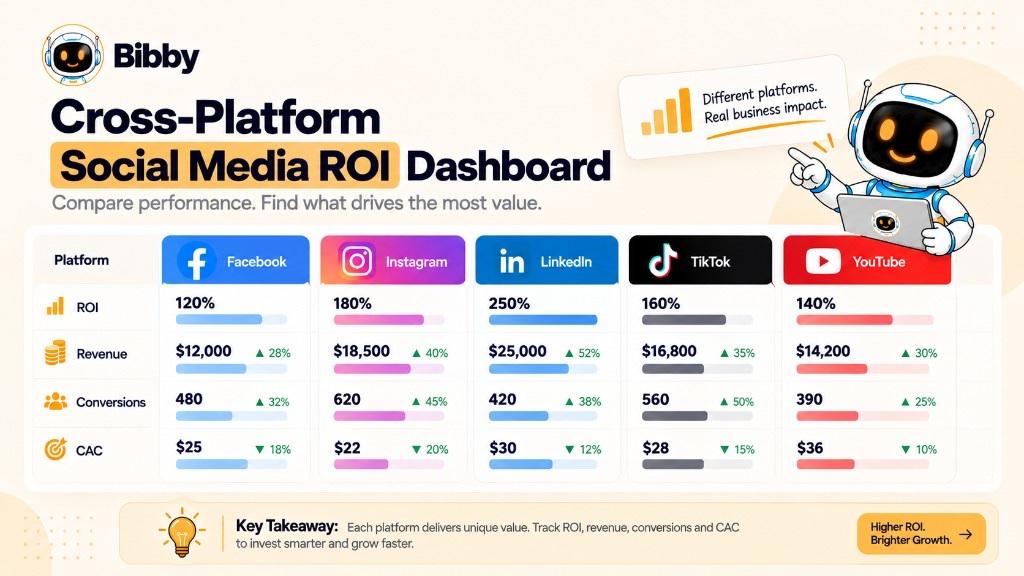
Use the same formula and adapt conversion metrics to each network’s role.
Facebook ROI
Facebook can support ecommerce, leads, traffic, and engagement. Track ad spend, organic content cost, clicks, traffic, leads, purchases, conversion value, CAC, and attributable revenue. Paid work belongs in Meta’s ads tools. Organic work still needs content and management cost.
Instagram ROI
Evaluate image posts, carousels, Reels, Stories, shopping features on the platform, paid ads, and creator collaborations. Supporting metrics: reach, engagement, saves, shares, profile visits, clicks, site conversions, purchases. Ecommerce can use purchase tracking. Awareness work may need assisted conversions. Bibby can schedule Instagram images, carousels, videos, and Stories; it does not add product tags or checkout.
LinkedIn ROI
Often B2B with a long path: post or ad → visit → download → qualified lead → opportunity → customer → revenue. Track qualified leads, CPL, demo requests, opportunities, CAC, revenue, and CLV. Immediate-purchase ROI can understate LinkedIn.
TikTok ROI
High reach is not revenue. Connect views to profile visits, traffic, leads, purchases, CAC, and revenue. Awareness campaigns may need branded search and assisted conversions.
YouTube ROI
Video can keep working after publish. Track views, watch time, clicks, traffic, leads, purchases, subscribers, assisted conversions, and attributable revenue. A tutorial may influence a later search purchase.
Compare Platforms Using the Same ROI Methodology
If Instagram includes content and management and LinkedIn includes ads only, the percentages are not comparable.
| Platform | Total investment | Attributed return | ROI |
|---|---|---|---|
| $5,000 | $12,500 | 150% | |
| $5,000 | $15,000 | 200% | |
| $5,000 | $17,500 | 250% | |
| TikTok | $5,000 | $10,000 | 100% |
| YouTube | $5,000 | $13,000 | 160% |
These rows are illustrations.
Do Not Choose Platforms Based on ROI Alone
Platform A: $1,000 in, $3,000 back, 200% ROI. Platform B: $20,000 in, $50,000 back, 150% ROI. B produces $30,000 more net return. Scale can also change efficiency. Weigh ROI, net return, volume, CAC, CLV, quality, scalability, and strategy.
Customers move across networks: TikTok discovery, Instagram research, YouTube, then Google. Distinguish direct vs. assisted conversions. Also compare formats inside a platform—changing from image to video can matter more than switching networks.
A cross-platform dashboard in an analytics product might include investment, revenue, ROI, ROAS, conversions, CAC, CLV, traffic, and assisted conversions, filtered by platform, campaign, format, organic vs. paid, and date. That dashboard is not a Bibby feature.
Bibby can reduce the operational cost of preparing assets, captions, and schedules across Facebook, Instagram, LinkedIn, YouTube, and TikTok. Chat can create a brand kit, campaign, posts, or regenerated captions. Measure whether hours or tool-stack cost actually fell. Do not assume a specific ROI lift.
Challenges in Measuring Social Media ROI
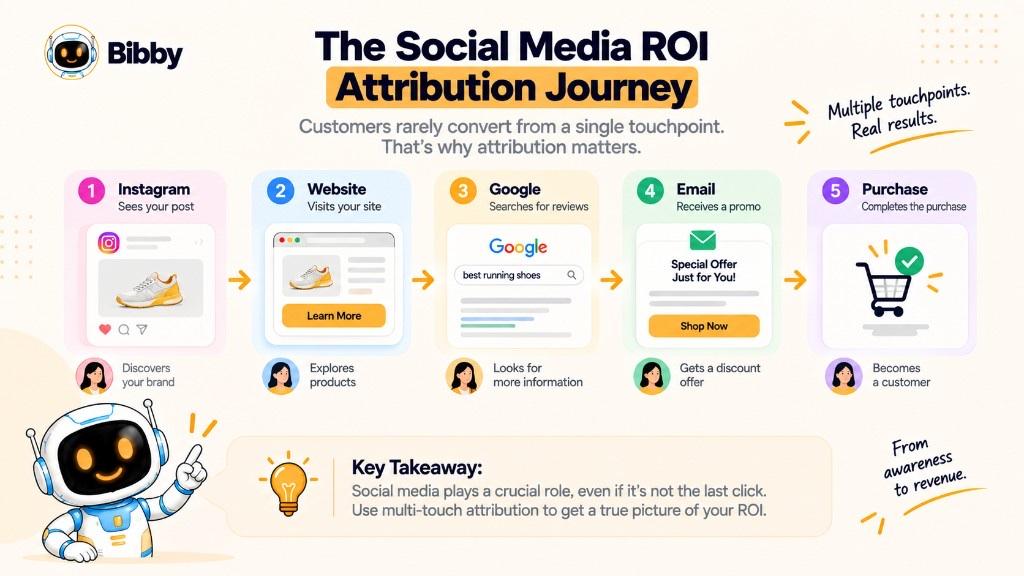
1. Attribution Problems
A customer may see Instagram, leave, search, return via email, and buy. Last-click can give email or search all the credit. First-click, last-click, linear, position-based, and data-driven models disagree. No model is perfect.
2. Long Buying Cycles
B2B, enterprise, services, finance, real estate, and high-ticket products can take months. A January interaction and a June sale will look empty if you only measure the campaign week.
3. Brand Awareness Is Difficult to Value
A video can introduce a brand with no click. Reach, impressions, views, brand search, and audience growth indicate awareness. They are not automatically dollars.
4. Cross-Platform Journeys
TikTok → Instagram → YouTube → website → Google → purchase. Measuring each network in isolation can double-count or miss the path.
5. Offline Conversions
Store visits, calls, appointments, events, and showroom purchases need CRM notes, promo codes, dedicated pages, or surveys—not a guess.
6. Shared Marketing Costs
A video used on Instagram, Facebook, YouTube, TikTok, the website, and email should not always hit social at 100%. Apply a consistent allocation to salaries, software, agencies, and production.
7. Attribution Windows Change Results
Document model, window, conversion definition, revenue rules, included costs, and reporting period.
8. Tracking Limitations
Cookies, privacy settings, ad blockers, cross-device paths, and platform reporting differences mean ROI is evidence-based, not perfectly precise. Do not treat missing data as a reason to scrape or bypass consent.
9. Vanity Metrics Distract
500,000 impressions + 30,000 likes is performance, not proof of financial return.
10. ROI Can Differ From Revenue Growth
Seasonality, promotions, search, email, launches, PR, organic search, sales activity, and the market can move revenue. Correlation is not attribution.
How to Make Measurement More Reliable
Define return, costs, conversions, model, window, and period in advance. Use UTMs, conversion tracking, site analytics, CRM, and ecommerce data consistently. Measure direct and assisted conversions. Compare trends over time. Add qualitative evidence from surveys or sales teams when analytics cannot see the full path.
Automation does not fix attribution. It can reduce time spent on preparation, captions, scheduling, and coordination. Time is a resource. Measure whether saved hours become lower cost, more useful output, or better performance.
How to Improve Social Media ROI
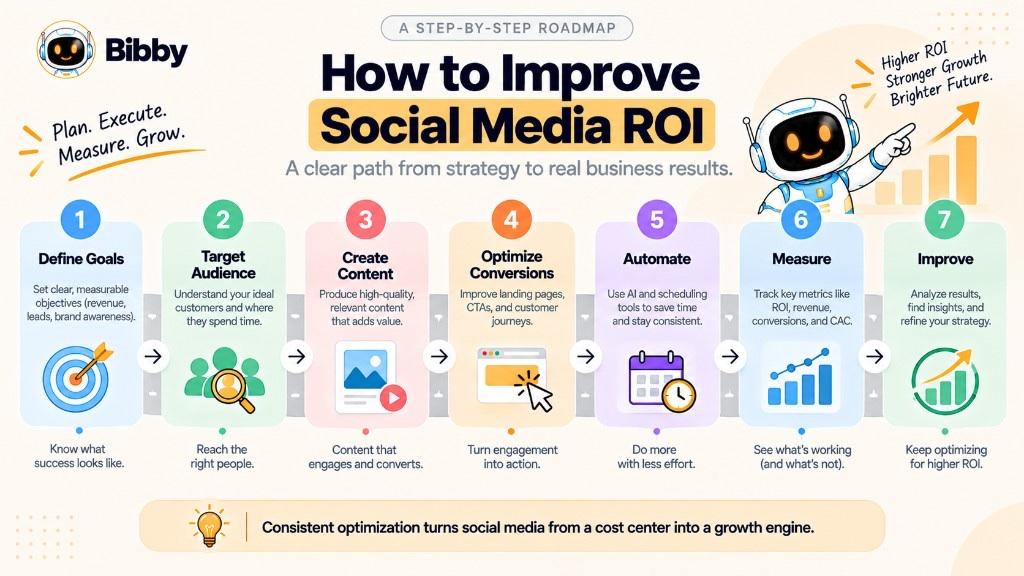
Improve return, reduce unnecessary investment, or both.
- Set clear business goals — “500 qualified leads this quarter,” not “more engagement.”
- Focus on high-value audiences — more impressions are not more money.
- Create content around objectives — education, product, case studies, demos, testimonials, promotions, and community each play a role.
- Repurpose what works — adapt a strong idea for Instagram, Facebook, LinkedIn, TikTok, YouTube Shorts, Stories, or a longer video. Do not paste the same asset everywhere.
- Test formats — compare A/B tests on conversion and money, not only engagement.
- Improve posting times — best time to post varies by audience and platform. AI-assisted scheduling can reduce manual timing work; it is not a reach guarantee.
- Improve the conversion path — content → click → landing page → offer → purchase. Speed, CTA, mobile, forms, and trust can raise revenue without more social spend.
- Optimize advertising spend — use ROAS, CPA, CAC, conversion rate, revenue, profit, and ROI in ads tools. Do not scale only because ROAS looks high.
- Track the whole journey — Instagram → website → email → search → purchase.
- Cut unnecessary operational cost — captions, scheduling, reformatting, and calendar work add up.
- Automate repetitive work — scheduling, caption drafts, publishing, campaign coordination. Keep humans on strategy, creative, research, analysis, community, and conversion.
- Double down on what produces results — Publish → Measure → Analyze → Optimize → Publish again.
| Area | Optimization question |
|---|---|
| Return | How do we generate more financial value? |
| Conversion | How do we turn more social traffic into valuable actions? |
| Investment | How do we reduce unnecessary cost and effort? |
| Efficiency | How do we get better results with the same resources? |
$20,000 from $10,000 is 100% ROI. The same $20,000 from $7,500 is about 166.7%. Sometimes the opportunity is on the cost side.
How Bibby Can Help Improve Social Media ROI
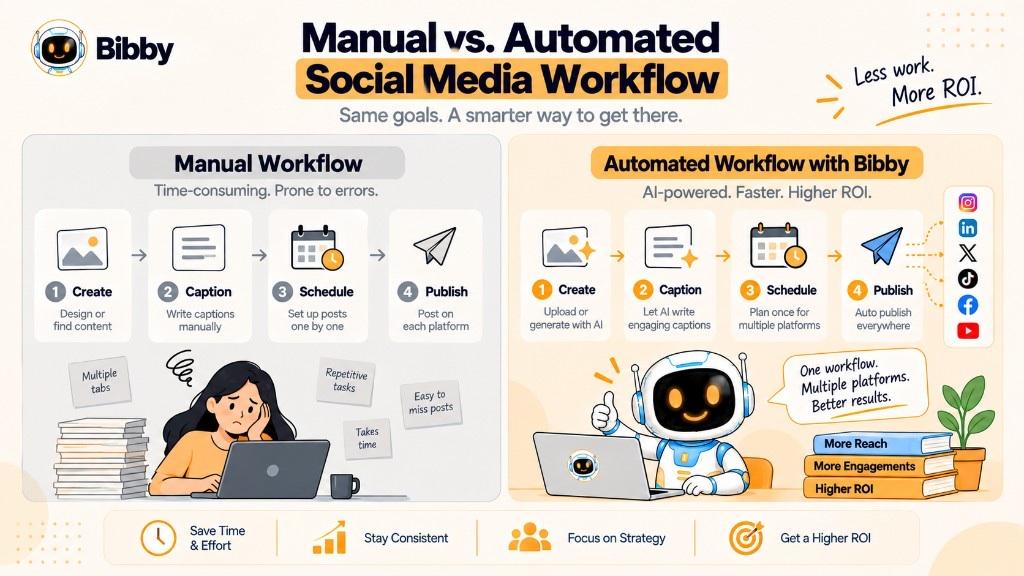
Strategy, targeting, creative, and conversion still determine most of the return. The cost of execution also matters.
Bibby is an AI-powered create-and-publish workflow—not an ROI, ads, or Insights product.
- Reduce management time — captions, post prep, scheduling, campaigns, and calendars are part of investment even when they never appear as an invoice line.
- Create from one path — upload or generate an image → choose a posting style → generate a caption → select platforms → schedule.
- AI captions — a faster draft you can regenerate and edit.
- Schedule across platforms — Facebook, Instagram, LinkedIn, YouTube, and TikTok. Not X.
- Formats — images, carousels, videos, and Stories.
- Chat — brand kit, campaign, posts, caption regenerations, and other content tasks.
Automation does not automatically equal higher ROI. Revenue still depends on audience, content, offer, conversion, CAC, distribution, attribution, and strategy. Measure hours, production cost, consistency, output quality, campaign speed, and then conversions and revenue.
If you generate the same $20,000 in attributed revenue and cut execution from $10,000 to $7,500, ROI moves from 100% to about 166.7% because investment fell—not because a tool created sales.
Social Media ROI Calculation Example for an Automated Workflow
Manual Social Media Workflow
| Activity | Monthly cost |
|---|---|
| Content preparation | $2,500 |
| Caption writing | $1,000 |
| Scheduling | $750 |
| Multi-platform publishing | $750 |
| Campaign coordination | $1,000 |
| Total operations | $6,000 |
Plus $4,000 ads = $10,000 investment. Attributed revenue: $25,000. ROI = 150%.
Automated Social Media Workflow
Ads stay $4,000. Operations fall so total investment is $6,000. Revenue stays $25,000. ROI ≈ 316.7%.
This does not mean automation produces 316.7% ROI. It shows the economics: the same return with a smaller investment improves ROI. Actual savings vary by volume and team.
| Activity | Manual | Automated |
|---|---|---|
| Content preparation | Repeated manual work | Streamlined workflow |
| Captions | Written from scratch | AI-assisted drafts |
| Campaign setup | Manual coordination | Centralized workflow |
| Scheduling | Platform by platform | Multi-platform schedule |
| Team time | Higher potential load | Potentially lower load |
Automation can raise return (more consistent publishing, faster tests, more time for strategy) or lower investment (fewer hours on busywork). Compare before and after: hours, cost per asset, output, consistency, conversions, revenue, CAC, and ROI. More posts are not automatically more value. Keep quality.
Social Media ROI vs. Other Social Media Metrics
Most social metrics measure activity. Social Media ROI measures financial efficiency.
Reach is unique people exposed. 100,000 reached ≠ $100,000 earned.
Impressions are displays, not unique people, and not revenue.
Engagement rate can show resonance. A post with 10,000 interactions and $500 revenue can lose to a post with 1,000 interactions and $8,000 revenue.
CTR measures the click stage. Clicks are not conversions.
Conversion rate does not include customer value. High rate + low AOV can lose to a lower rate + high CLV.
Follower growth is audience development, not customers.
CPA is acquisition cost. Pair it with CLV.
CLV is the customer-value view; ROI compares that value (or nearer-term return) with investment.
| Metric | Primary question |
|---|---|
| Reach | How many unique people saw the content? |
| Impressions | How often was it displayed? |
| Engagement rate | Did people interact? |
| CTR | Did people click? |
| Conversion rate | Did they take the desired action? |
| CPA / CAC | How much did acquisition cost? |
| Revenue | How much financial value was generated? |
| CLV | How valuable are customers over time? |
| Social Media ROI | Was the return worthwhile relative to investment? |
Awareness work may prioritize reach and brand search. Ecommerce may prioritize purchases, ROAS, CAC, profit, and ROI. Diagnose a weak ROI by walking backward: distribution, content relevance, message, landing page, then cost and margins.
Conclusion
Social Media ROI asks whether the financial value from social justifies the resources you put in. It goes beyond likes, followers, reach, and impressions.
- ROI = [(Return − Investment) ÷ Investment] × 100. Include the costs that belong in the question you are asking.
- ROI is not ROAS. ROAS is ad-spend efficiency.
- Engagement is not ROI.
- Attribution and conversions are critical.
- Organic social can have measurable ROI because time and production are real costs.
- There is no universal good percentage.
- You can improve both sides of the equation—better targeting and conversion, and lower unnecessary cost.
- Automation can help efficiency. Bibby creates, captions, campaigns, and schedules on Facebook, Instagram, LinkedIn, YouTube, and TikTok. It does not calculate ROI or replace Insights.
- The best measurement is consistent and transparent.
The useful question is not the biggest dashboard number. It is: How much measurable value are we generating from the resources we invest in social media?
ROI is the broader finance term if you want the general formula. Social media analytics covers the metrics that feed the calculation. Create a Bibby account when you want a faster create-and-schedule loop—then measure return in the tools that actually hold your revenue data.